1. 2ndF RAN X 30 =16.23 = 16 F
2. 2ndF RAN X 30 =13.74 = 17 M
3. 2ndF RAN X 30 =16.32 = 16 F this one has been used once so we ignore it.
4. 2ndF RAN X 30 =15.75 = 16 F this one has been used once so we ignore it.
5. 2ndF RAN X 30 =4.2 = 4 F
The first 4 females are the ones that will be put in to the pre test.
You cannot have the same number twice because you would be asking the same sample twice so you would get the same result.
The samples will be chosen out of the registration of each class. By using the random technique on the calculator. I will avoid bias by using somebody else to gather my result that does not know about my hypothesis or theory. This will get rid of subject bias and experimental bias.
I could improve my sample by making it bigger and extending the variety.
A small pre-test
The time chosen for the subjects was 10 seconds to look at both length and angle
This pre-test will consist of 8 people 4 male 4 female
-Mean = total of items / number of items
Median = middle value
Mode =most common
Range =how far from the smallest to the biggest
Stem and leaf diagrams
These diagrams make it easier to find the mean median mode and range as you can arrange the numbers in order of size then you count to the middle number to find the median the mode is the most common median is all the numbers added together and divided by the amount of the numbers and the range is the space between the smallest number and the biggest number.
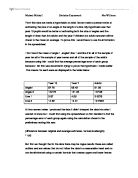
Length
3.5+ 4+ 4.8+5+5+5+5+5=37.3
Mean: 37.3 / 8 =4.6625
Median: 5.5
Mode: 5 over all most people are close to the length
Range: 1.5
Angle
Close to the angle over all
20+30+30+30+30+35+40+40=225
Mean: 225 % 8 = 28.125
Median: 35
Mode: 30 most people are close to the chosen angle
Range: 20
From these two stem and leaf diagrams
Cumulative frequency and Box and whisker graphs
This is how you compare the two difference using the graph you can place them on top of each other and compare the difference to the samples and see if one is different from the other
Box and whisker graphs
These graphs are the main comparing graphs from these you can tell how big the range from the other opposing graph and also if the median results are closer to the real results.
Small conclusion
This test was to see if my methods would work I realise there is nothing to compare the grids to but it works on the graph and gives me the cumulative frequency. no I know that all of my theories work I can use them in the real tests and compare graphs and also I can see the base plan of what I have to do for each test. This pre test is the base for all my tests. Using this I can work my way around my coursework. In all the tests I have used Microsoft excel to do some of my calculations. To make this pre test better I could add something to compare my graphs to and also have more samples to work from.
How I will evaluate if females are better than males are by the graphs that my results give and the stem and leaf, mean median and mode. The final conclusions will give a valid explanation why females/males are better at estimating length and angles and will also mark any mistakes I have made.
End of pre-test
Test 1
Now I have 149 year 7 females and males and for my sample I am going to choose 30 females and 30 males
The reason for doing this experiment is to determine if males are better than females at estimating length and angles. To get these samples I will use the Ran# technique until I get 30 females and 30 males in year 7
2ndF RAN X 149 =
I could improve my sample by having a wider range of subjects to chose from and also have a bigger sample the calculator technique is proven in the pre-test
These are the 149 children who were used to get 30 random males and 30 random females:
THE ONES UNDERLINED WERE THE ONES CHOSEN FOR THE SAMPLE OF 60 BELOW:
I did this calculation many times. And ended up with
30 random males and 30 random females.
If 1 or more of the 60 chosen were absent I chose the nearest female or male to my assistant (who asked the questions and made each of the 60 year 7 review the angle and the line for 10 seconds and collect the data). any one who is not present will be taken out of the test and replaced by the nearest male if the subject is a male or female if the subject is a female, taking the absent body’s place.
The results
I choose 30 males and 30 females for my sample because I think it is a right size sample to work from, as it will get me varied results.
I could improve my sample by having a wider range of subjects to chose from and also have a bigger sample from these results I can see from observing my chart that males play more sport than females.
Stem and leaf
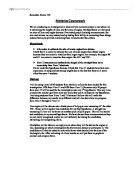
Female
Female
Angle
Mean 1152 / 30 = 38.4
Median 34 the median is close to the original angle of 36
Mode 30 this means that most females are closer to the original angle
Range 57
The median is close to the actual angle
Length
Mean 175.4 / 30 = 5.846666667
Median 5 close to 4.5 cm
Mode 5
Range 70
Most females are closer than the males to 4.5 cm plus one female estimated the angle to be 4.5 which was correct
Cumulative frequency and Box and whisker graphs
Male
Stem and leaf
This stem and leaf counts to 29 this is a mistake but dose not affect my results
Angle
Mean 1167 / 30 = 38.9 (1167 / 29 = 40.24137931)
Median 37
Mode 37 the male majority are closer than the females on angles
Range 66
The mode and the median are the same meaning that the 15th male was also in the median
Huge range no males got the angle right
Length
Mean 189.9 /30 = 6.33
Median 5 very close to the original angle of 4.5 cm
Mode 4 the median is also the same as the females median
Range 14
The range for the males is bigger than the females because there are a couple of males that estimated a lot higher than I would expected
Cumulative frequency and Box and whisker graphs
Conclusion
Males are better at estimating lent as the box and whisker graphs prove though the males have a very big range most of the males have been close to the 4.5 cm chosen
An experiment to see if playing sport helps at estimating lengths and angles
This is a test including only 10 people that play sport and 10 people that don’t
In this test sex is not important as it is only comparing non-players against players
The players and non-players have been chosen at random from a group of 60 people.
Here are the results:
I could improve my sample by having a wider range of subjects to chose from and also have a bigger sample.
Non-players
Mean 62 / 10 =6.2
Median 5
Mode 4
Range 6
You can see that the non-players have
Mean 402 / 10 =40.2
Median 25
Mode 20
Range 49
Most of the non players have there angle marked between
Cumulative frequency and Box and whisker graph
Players
Stem and leaf
Mean 62.4 / 10 =6.24
Median 6
Mode 8
Range 8
The players are more spread out than the non-players
Mean 337 / 10 = 33.7
Median 32
Mode 32
Range 30
The angle seems to be ….
Cumulative frequency and Box and whisker graphs
Conclusion
I used Microsoft excel for some of my calculations as humans can make errors and that it is more accurate.
Also I used this program to save time as it would have had taken longer for me to write the tables up. I can see from my graphs
An experiment to see if age makes a difference:
Plan = an abbreviation of the main plan on page 1
1) I will work out the mean median mode and range of the results of the year 7 samples and the year 10 samples
2) I will make stem and leaf diagrams
3) I will make box and whisker diagrams
4) I will make a conclusion
METHOD the same sort of method used on the first two experiments.
I got a sample of 60 year 7 and a sample of 60 year 10s and used the random technique on the calculator to select 30 year 7 at random and 30 year 10s at random. I will avoid bias by using somebody else to gather my result that does not know about my hypothesis or theory. This will get rid of subject bias and experimental bias.
I think that the older people are better at estimating angles and the length because they have more experience at doing so from further education and more experience.
For this experiment I am using excel again as it it’s a time saving device and also Is a excellent calculator at fast speed if you know the formula to put in for this experiment and all of these experiments I have used the =SUM formula the most. Year 10s chosen underlined in red:
I could of hade made my sample bigger but that would had of taken more time and also a sample of 30 is easier to work with.
Year 7
Stem and leaf diagrams
Angles
Mean 1124 / 30 = 37.5
Median 32
Mode 30
Range 70
The year 7s are closer to the angle
Length
Mean 186 / 30 = 6.2
Median 6
Mode 4/8 there are two even modes for this graph as four and eight
Range 7 have the same amount on the graph so I put both of them down
Cumulative frequency and Box and whisker graphs
Year 10
Stem and leaf diagrams
Angles
Mean 1153 / 30 =38.4
Median 40
Mode 45
Range 38
Length
Mean 130.8 / 30 = 4.3
Median 4.5
Mode 5
Range 3.5
Cumulative frequency and Box and whisker graphs
Conclusion