T
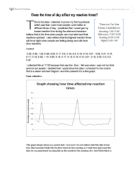
His is the data I collected to prove my first hypothesis which was that I (and most people) work better at different times of day. I predicted that I would get my lowest reaction time during the afternoon because I believe that is the time when people are most alert and their reactions quickest. I also believe that the highest reaction times will be at night when people are feeling sleepy and will have slow reactions.
Control:
0.35, 0.28, 1.03, 0.29, 0.22, 0.17, 0.2, 0.19, 0.2, 0.19, 0.16, 0.21, 0.23, 0.21, 0.18, 0.17, 0.16, 0.59, 1.16, 0.28, 0.18, 0.17, 0.18, 0.19, 0.18, 0.21, 0.18, 0.22, 0.2, 0.2, 0.45
I collected this at 17:02 because that was the time; I felt was when I was not too tired and not too awake! I decided that I would show the data I collected for the control first in a steam and leaf diagram and then present it in a line graph.

This is a preview of the whole essay
Teacher Reviews
Here's what a teacher thought of this essay
There are some nice ideas in this work but there is a very misleading use of graphs without a horizontal scale. However, some good examples of stem and leaf diagrams even if the keys are wrong. 2 stars