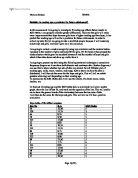
Boys table of Stratified samples:
This is a table of the boys’ results I selected. I will then go on to use this information to make graphs, bar charts and so on. I
Here’s The Girls table of stratified samples.
I have drawn up a table one for the boys and girls showing their reading age and KS3 Maths results. I used random sampling using the calculator. By doing this I entered the amount of student I had to select from. Then pressed the random button, this gave me a random number between 0 and this amount students I had. I kept doing this until I had 36 random numbers for boys and 24 random numbers for girls. This is because I took 25% of 143 boys that were they’re which resulted out as 36. So I did the same for girls and took 25% of girls, which came out as 24.
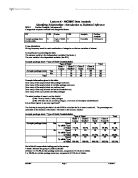
Mean = 273/24 = 11.4
Median = 11.4
Lower quartile = 10.3
Upper quartile = 12.6
Inter quartile Range = 12.6 – 10.3 = 2.3
By adding all the frequencies it gave me a total of 24. This shows the number of girls that was selected. I then divided it by 273, which gave me 11.4, and that is how I found the mean.
The addition of all the frequencies gave me a total of 36. This shows the number of boys that was selected. I then divided it by 383 which gave me 10.6, that is the mean for boys.
Median = 10.4
Lower quartile = 8.7
Upper quartile = 12.4
Inter quartile Range = 12.4 – 8.7 = 3.7
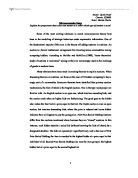
Using the information I read from the cumulative frequency curves I drew box-and-whisker diagrams, showing the minimum and maximum values, the median, and the upper and lower quartiles
The result in doing the Box and whisker plot I’ve seen that the lower 25% of boys have a reading age below 8.1 whereas the lower 25% of girls have a reading age below 10.3. This shows us that girls are doing better than boys.
Below are a table of students born in September and their KS3 Maths results n reading age.
* I am going to miss out these people because of their missing data
In the table above I can see that most of them did very well in their KS3 Maths, they scored marks like level 7’s, 6’s and 5’s which are great marks to score.
Here is another table of students born in August:
* I am going to miss out these people because of their missing data.
In this table I can see that the most frequent score was level 4 at KS3 Maths which is not as good as the other group of students born in September. However, one student scored an 8 the highest score you can get, that no student in September achieved.
Now that I’ve finished both tables I can see that the students born in September achieved better than the students born in August, they had gotten a higher mean too. I think that this is because of the September students being born before the August students, therefore having a head start in learning giving them that chance to do better.
Conclusion
In this investigation I have seen that girls are doing better than boys. However I have notice that in my scatter graphs that there is no correlation, which resulted in no relationships between the two, sets of data (Reading Age & KS3 Maths). Girls’ median and mean are higher than boys so this is further evidence that they’re doing better. The question was “Is reading age a predictor for future attainments?” and my answer is No. I don’t think that the two genders possibility of achieving well depends on their reading age, as shown in my investigation. To also prove my theory I have done two tables of students born in September and students born in August showing me that September students achieved higher than August Students. I also saw that the students who got level 7’s and 8 had no reading age but the students who did have reading age got level 6’s 4’s 5’s and so on, below what the others got who didn’t have a reading age. Therefore, reading age is not a predictor for future attainment, it doesn’t necessarily mean that if you have a higher reading age than others that you will also get a higher score. This new theory has shown me that my prediction was wrong at the beginning and that reading age does not depend on what you achieve it’s the effort and skill you put in that truly makes a difference.