The results for Godik et al’s experiment concluded, ‘no noticeable differences between the total number of kicks at goal of rivals by the soccer players of different teams whether winners, losers or those that played in a draw’.
Godik et al considered a number of factors in drawing conclusions from this experiment. They were that:
- The kicks were performed under severe competitive conditions and winners’ kicks were statistically more accurate than losers’ kicks
- In competitive criteria of accuracy, juniors differed little from highly qualified footballers
The final conclusions drawn were that poor accuracy during training may be one of the reasons for accuracy not being very high during competition (all figures and conclusions mentioned are directly from the source, i.e. the experiment carried out by M. Godik et al). There is a relation between the speed of the run-up and the accuracy of kicking. Finally, the accuracy of kicks at goal changed with increasing levels of fatigue, caused by the training load.
There are obvious similarities between this experiment and ours. The focal point of our experiment is of course the accuracy of each kick, although unwanted variants - such as those mentioned as factors by Godik et al – needed to be considered. Although fatigue may play a part in the results of our experiment, we consider it to be a natural variant, bearing in mind also that not all of our subjects play regular football as in those in Godik et al’s experiment.
Method;
- 1 x size 5 indoor football
- 1 x regulation 5 a-side goal or wall measured to exact specifications of a 5 a-side goal, marked with chalk
- Strong tape, preferably duct-tape
Prior to the training sessions, to maintain if a progression had been made there needed to be carried out a `pre-test` for each individual of the group of subjects of which there were six. All of these subjects were sports scientists, as to maintain a constant throughout, although these six subjects, me included are of mixed ability. These six subjects represent the population of sports scientists, with any large number of this population obviously inaccessible, the results gained shall be indicative of the sports-inspired populous we are concentrating on.
The pre-test would be carried out by each member of the group, one after the other, in the same goal, in the same environment, from the same distance away, and using the same football, so that the results would remain as fair and as constant as possible. These variables of environment, setting and equipment need to have as little relative influence on the outcome of the results as possible, thus insuring that the only influence on the results is the actual subject we are testing for, that is the response to training of the six subjects.
There are, of course, variables that may affect the outcome of the results, which for one reason or another at the time may be out of control of the group. The natural variations of six individuals may be considered, the general fitness of the six needs to remain as close to constant as possible, allowing for the case of injury and/or illness.
The problem of attendance to training and to the pre/post tests leads to some individuals training in their own time, or in some cases due to circumstance not at all. Non-attendance to the pre/post tests may require that the absent subject performs the test(s) in a different environment or using different equipment to those present at the original tests, although the influence of this and other factors are under interpretation to scrutiny, they nevertheless have an influence, reducing the possibility that the final results obtained could be applied correctly, without question, to the population that we are studying.
All in all it can be said that the lesser amount of unwanted variables that there are, the more accurate the results of the tests will be.
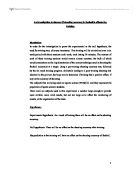
Each member of the group was asked to hit a moving ball within a certain area, the area, marked by four cones in a square ran at an angle to the goal approximately 10 metres from the target.
The goal itself; a normal indoor 5 a-side goal would be divided into six equal sections, with tape, detailing the points allocation for each section that the ball was scored into.
NB. The ball must go into the goal for the correct points to be allocated; shots that rebound of the posts/crossbar will be scored at 1 point regardless of the section(s) the ball passes through.
Diagram of the set-up
There are two different areas for shooting, situated to the left and right of the goal, this caters for those players who shoot with their left foot and those that shoot with their right, regardless of foot preference each shot must travel to the furthest post away from the player (across goal) to score the maximum 3 points per shot.
The points were accumulated accordingly after each person had 10 shots on goal.
Following the pre test the group participated in three training sessions per week, focusing on technique building exercises.
Initial exercises entailed the shooting of a stationary football; hitting a target approximately 5-10 metres away depending on the pre-test scores of the individual. Those with lower pre-test scores had to hit the target from a shorter distance, whilst those with higher pre-test scores would move further away, in every case the `target` initially would be a normal indoor 5 a-side goal.
This `target` practice put emphasis on correct technique, and whilst not focusing on hitting specific areas of the goal, which we would again progress to into the duration of the six week sessions, focused on just scoring into the goal.
The target practice drill would form the vast majority of each 30 minute training session, with alternate drills consisting of perfecting technique, but not in hitting a target but reaching the goal of improving the fundamentals of each shot. i.e. keeping the ball low, and striking the ball with the instep of the foot.
After the duration of the six week training schedule, a post test was to be taken by each member of the group, each member would take part in an identical test to the pre training test, taking 10 shots at the 5 a-side goal, and scoring their accumulative points total against the score in the pre test.
Results
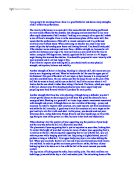
Pre training test
This graph shows the results of the pre-training test carried out by the 6 subjects.
Table showing results of post-training test
Graph to show results of post-training test
Statistical analysis
The word 'Statistics' is derived from the Latin word 'Statis' which means a "political state." statistics are closely linked with the administrative affairs of a state such as facts and figures regarding population, housing, food, financial resources etc. What is true about a government is also true about industrial administration units, and even one’s personal life.
The word statistics has several meanings. In the first place, it is a word which describes a collection of numerical data such as employment statistics, accident statistics, population statistics, birth and death, income and expenditure, of exports and imports etc. It is in this sense that the word 'statistics' is used by a layman or a newspaper.
Secondly the word statistics is used to describe a branch of applied mathematics, whose purpose is to provide methods of dealing with collections of data and extracting information from them in compact form by tabulating, summarising and analysing the numerical data or a set of observations.
The various methods used are termed as statistical methods and the person using them is known as a statistician. A statistician is concerned with the analysis and interpretation of the data and drawing valid worthwhile conclusions from the same.
Lastly the word statistics is used in a specialised sense. It describes various numerical items which are produced by using statistics (in the second sense) to statistics (in the first sense). Averages and standard deviation are all statistics in this specialised third sense.
Nominal data
Nominal data categorises data that are distinct from on another. No one individual item can be placed into two separate groups.
e.g.
In a study of people using a local gym the researcher uses
`1` = male adults
`2` = female adults
`3` = male children
`4` = female children
These scales can never be added, divided, subtracted or multiplied.
Ordinal data
This type of data has similar properties to nominal data, but it also indicates a rank of order amongst the data. Individual data can be arranged in a high to low sequence, or vice-versa, but this rank number doesn’t indicate a quantity, the numbers between each interval are not of the same value either.
e.g.
A ranking for a football league
- Team A
- Team B
- Team C
- Team D
- Team E
If there are 15 teams altogether, the researcher cannot say that the first ranked team is 15 times better than the 15th ranked team.
Interval
Used with ordinal ordering, interval data actually states the distance of value between say, the same football team in first position, and the team in 10th position.
e.g.
Team A pts. 55
Team B 51
Team C 50
Team D 47
These values show exactly the distance between any two subjects, although we cannot say that the team in first position is 5 times better than the team in fifth.
Ratio
The ratio scale starts at absolute zero; all the data involved can be added, subtracted, divided or multiplied. This type of data is especially useful in physical science.
e.g.
50 points is 40 points more than 10 points, and twice as many as 25 points.
T-tests
The results of our experiment along with graphs showing the results can be found on pages 8 and 9 as well as the attached paper.
For the statistical analysis of the results we will use a test, involving our results data, called “correlated means”, this test is used if the researcher wants to find out a significant difference between two conditions/situation (the correlation in this case), exists between the two sets of data consisting of the pre and post training tests. If the result provides a correlation, which can be weak or strong, this proves, or disproves the theory that training improves shot accuracy.
The correlated means theory has an applied formula;
∑ d
t = ----------------------
n ∑d - (∑d)
----------------------
√ n-1
this is where
d = difference in rank between the items in a pair
n = number of items
∑ = the sum of
By using this formula and substituting the relevant numbers in we can calculate our T-calc (our calculated number) and our T-crit (the probability in decimal form of the results representing the population when the t-calc is entered into the significant values table (copy attached))
Therefore;
Sum of difference squared = 36+49+36+25+36+25 = 207
Sum of differences = 6+7+6+5+6+5 = 35
We can now substitute this number (207) and the number of items (or subjects (6)) into the equation.
t = 35
-------------
--------------
6x207 – (35x35) = 1242 – 1225 / (n – 1) = 3.4
√3.4 = 1.8439088914
35 / 1.8439088914 = 18.9814
this value for t, or the t calc as before is therefore 18.9814
When this value is entered into the critical values table, having first subtracted 1 from the value of n (the degrees of freedom, or margin of error, in our case this number is 5), and the table gives us values for the 0.05 level (a 95% possibility that the result is applicable to the population in question).
This value is the t crit, if this value is greater than 0.5 it is said that there is a high possibility of a significant difference between the values, or in our study a high correlation between the effects of training to improve shooting accuracy.
Since there is a correlation therefore, we can now reject the null hypothesis that there will be no effect to shooting accuracy after training, and except the experimental hypothesis.
we see the value for the 5 entitled degrees of freedom under the 0.05 value is 2.571, our number, 18.9814 is greater than this number, indicating the high correlation/relationship and therefore a high probability.
Discussion and Conclusion
Our results showed that training does have an effect on the shooting accuracy of the subjects in question. Therefore, we can draw parallels and conclusions as mentioned by Godik et al, as results from both experiments produced similar results. Although the content of Godik et al’s training is unspecified, we must assume that emphasis on technique - particularly shooting technique – formed an integral part of each session. Again we can run parallels between this and our experiment, in the fact that our training sessions placed emphasis on technique above all else. Although the results proved both my prediction and the experimental hypothesis right, there are, of course, considerations which need to be taken into account. Natural deviations in results may occur because of natural or unwanted variants. Some of these variants may include:
- The frequency, intensity and duration of each training session remaining the same
- The environment in which training sessions take place (weather being a natural variant)
- Playing surface remaining constant during training sessions and both tests
- There will be a natural variation between subjects because of the participation of some in regular football more so than others
- For both pre- and post- tests the equipment as mentioned in “method” needs to be the same, as does preferably the kit used by the subjects during both tests
- There is a natural deviant between each subject’s lifestyle and any contraindications during training sessions and tests, and days leading up to both i.e. sleep/eating patterns, injury or any other exercise partaken previously.
There were some irregularities because of attendance or non-attendance of training sessions and either pre- or post- tests, therefore training was either not undertaken or was unmonitored. Also, not all tests were taken at the same time.
Evaluation
The experiment did not go as well as planned because of aforementioned absences, particularly from training, usually undertaken by only two or three members of the group. Although this did not have an effect on the ultimate conclusion that we drew in rejecting the null hypothesis, the accuracy of the results were definitely affected. If I repeated the experiment again, the primary factor which I would change would be the attendance.
Contents
1 – Introduction and Hypothesis
2 & 3 – Literature review
4, 5, 6 & 7 – Method
8 & 9 – Results
10, 11 & 12 – Statistical analysis
13, 14 & 15 – T-tests
16 - Discussion and conclusion
17 – Evaluation
19 – Bibliography
Also attached are graphs and copies of the study by Godik et al that formed the literature review.
Bibliography
Study by M.Godik et al taken from; Reilly, T. Clarys, J and Stibble, A. Science and Football II (year and publisher unknown), United Kingdom
Boardman, M (1987) Physiological aspects in sport, MN Vale, USA
Greenaway, K (1980) Training and Development in sport, Llewellyn, United Kingdom
Wilson, R (1990) Science in Soccer, Webb-Gillen, USA