Results:
Results of Length Variation in a 0M Solution
Starch Test: I added four drops of iodine solution to a 1cm cubed sample of potato and swede, and observed that both turned a blue/black colour, but potato more so. I have concluded that potato contains more starch than swede.
Glucose Test: I mashed the swede sample and placed it in a boiling tube, covering it with Benedict’s reagent. Then I covered a sample of potato with Benedict’s reagent and placed both boiling tubes in a water bath for 4 minutes. I saw that the potato sample turned a green/orange colour whereas the swede changed to dark orange/red. This shows me that more glucose is present in the swede sample than the potato.
Method for Swede Chips
- I cut out 24 chips, all of the same length (3.5cm) using a cork borer and weighed each chip, noting down their individual weights. I made sure to cut the ends off the swede chips for the same reason stated in the potato experiment.
- I added three chips of two new concentrations (0.3M and 0.5M) to get a more accurate result on my graph which it would be easier to spot any anomalies on.
- I measured out 20cm cubed of each solution and filled three test tubes with each concentration so I could work out an average which would make my results more accurate.
- Next, I used a pin to attach each swede chip to a rubber bung and placed them all securely on the test tubes to prevent leaking.
- I turned all the test tubes upside-down, and left the chips 48 hours before collecting my results using the same method as in the potato experiment above.
Swede Results:
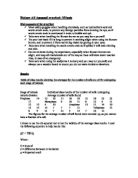
Analysis
I drew a graph comparing the % change in mass to the concentration of sucrose solution (mol dm-3). From my graph, I can see that as the concentration of sucrose increases, the % change in mass of the chips goes from negative readings (the chips lost weight) to gradually more positive readings (the chips gained weight through osmosis) as the concentration of sucrose became closer to 0M. For example, my reading at a high concentration of sucrose solution was negative and at a reading closer to 0M it gradually became a higher more positive number. This is what I predicted to begin with, as osmosis has taken place, causing the water molecules in the chips at stronger solutions to diffuse across the semi-permeable membrane out of the chip, which in turn caused them to decrease in weight.
However, in my graph there are some anomalies which I have highlighted. For example, the chips at 0M concentration gained a lot more mass than was expected, although this may be because the chip’s surfaces had some water left on after drying, which means that they needed to have been dried more thoroughly to obtain a more accurate result. Some of my chips lost more mass than was first expected, but this could be explained by some cells being lost when the chips were pushed on and pulled off of a pin. Also, the fact that the chips were in the solutions for approximately 48 hours could have led to parts disintegrating and small areas of swede breaking off.
The conclusion that I have drawn from analysing my results is that the water potential of swede becomes more negative as the concentration of solution that it is suspended in increases. This can be explained by looking at the definition of water potential, as the definition states that water potential is the capacity of a system to lose water, so in pure water the water potential would be zero. However, at a concentration of 1M, the swede had a low water potential as there are were solutes in the strong solution, and the water potential is calculated by adding solute potential to pressure potential.
From this, I have proven that my prediction was correct, as I predicted that the chips would lose mass and have a more negative water potential in a stronger solution. The reason that the chips lose mass in a higher concentration of solution can be explained by the definition of osmosis. Osmosis is the diffusion of molecules from a high water potential to a low water potential across a semi-permeable membrane, and because the water potential was more negative in a solution which had a larger amount of molecules in, the rate of osmosis increased, as the water molecules inside the chip diffused out across the semi-permeable membrane into the solution of sucrose which had a higher number of molecules. The chips in the stronger solution would also have a lower solute potential than the chips in the weaker solutions, as a chip surrounded by pure water would have more solutes in it’s vacuole than the water outside it would contain, so the osmosis would take place from the higher concentration (the water) to the lower concentration (the chip), causing the chip to become more turgid. This is what was observed in my results, as all the chips from the 0M solution to the 0.4M solution, not taking into account any anomalous results, gained in mass.
However, I would have predicted that my the graph I drew comparing the rates of osmosis to the concentrations of solution would level off at the beginning, as the cells would have been fully turgid due to diffusion from the lower solute potential in the surrounding water to the higher solute potential inside the swede cells. This was not the case on my graph due to my anomalous results, although the general trend was as expected. I think that if I had added more concentrations, had I had the equipment to do so, then I would have had points that were closer together and it would have been easier to tell whether the graph was levelling off at the beginning. At the end, the graph should have levelled of again as the cells would be fully plasmolised due to the solute potential in the surrounding solution and the low solute potential in comparison inside the cells of the swede chip, although again this wasn’t the case, probably for the same reasons stated above.
Although my results for the potato experiment conducted in the preliminary work and the swede experiment conducted for the main experiment seem very similar, if not the same, I can prove that they are not scientifically identical as I carried out a Benedict’s test for non-reducing sugars and the iodine test for starch. After mashing the samples of swede and potato and placing them in separate boiling tubes, I covered them with Benedict’s reagent and placed them in a water bath. After 4 minutes, which I timed with a stop-watch, I removed the samples and observed the colour changes in both samples. The potato sample had changed to a green/orange colour, whereas the swede sample had turned to dark orange/red. This showed me that more glucose molecules were present in the swede sample than the potato.
After taking two separate samples of swede and potato again and placing them in different test tubes, I put approximately 10 drops of iodine onto each sample, and again observed the change in colour. Both samples changed to a dark blue/black colour; however, the swede sample did not turn as dark as that of the potato, which showed me that more starch was present in the potato sample. Both these tests show me that potatoes and swedes are scientifically different, as do the results from each experiment. Although the same patterns of osmosis and changes in water potential are observed each time, my swede results were far more irregular and anomalous than my potato results, which showed a steady and expected pattern of change. This may be because of the reasons I explained earlier in the analysis, or because scientifically the potato and swede samples are different.
Conclusion
The general trend shows that the water potential of the swede chips is higher in a weaker solution of sucrose, although the expected masses were not always observed due to underlying circumstances. I expected my graph to level off at the beginning as the cells would be fully turgid and full of water, however due to underlying factors such as pieces of swede breaking off, this was not the case. The same applies to the end of the graph, where it was expected to level off as the cells of the swede would be fully plasmolised. However, I would have needed more repeat readings and even stronger concentrations for this to be observed on the graph.
I discovered when I drew the error bars for the 95% confidence interval that the bars were very big, especially on the readings for 0.2M. A 95% confidence interval is the probability that the true mean lies within this range, and the reason for this may have been that a lot of excess water was on the chip causing the readings to be very varied, or it could have been that three readings were not enough to make a generalisation, and if I were to repeat the experiment it would be sensible to use more swede chips. However, the environment that I was carrying out the experiment in meant that not enough test tubes were available for me to do this. My error bars for the 0.5M reading were also very large, which means that I do not have much evidence that my answer is the “actual” answer. This, however, could again be because more readings were needed for a more precise result, or because some swede cells were damaged or broken off during the pinning process.
Overall, I have discovered that although my results follow the general trend of what I expected to happen, they do not match my prediction completely as my results are hard to generalise, and the confidence intervals are not at 95% because of underlying factors and lack of equipment for repeat readings.
Evaluation
I believe that the particular method I followed during the experiment was not particularly suitable in order to obtain accurate results, as I discovered that my error bars were very large and did not give me particularly reliable results, and my repeats were very far apart. However, I believe that if I were to repeat the experiment taking more readings, my results would have been more accurate and easier to generalize, plus my confidence intervals would closer to the “actual value” as I would have a more precise average reading. Another way to improve the general accuracy of my experiment would be to dry all the chips as well as each other, although the environment that I was working in prevented me from doing this.
During analyzing my results, I discovered that a few of my results were anomalous and did not follow the trend set by the line of best fit. My reading for 0M was unusually high, and this could have been caused by any excess water which was unintentionally left on the chip after it had been in the solution for 48 hours. Also, because the swede cells were fully turgid, it may have been impossible to get a reading that was 100% accurate as water would have kept on leaking out of the chip slightly causing a fluctuation in my readings. I found my 0.2M readings slightly above average, but this was again probably caused by excess water left on the chip after drying. My readings for 0.6M and 0.8M did not lose as much mass as predicted, but this was probably caused again by either excess water or solution left on the chip, or just the fact that more readings were needed to obtain a higher level of accuracy. However, there were not enough test tubes available at the time of the experiment to implement this idea.
Limitations
The main sources of error which affect the accuracy of my experiment are the way that the chips were suspended in the solution by the pin and the method that the surface water of the chips was dried off. The effect of these sources or error cause my confidence intervals to fluctuate and make my entire experiment less reliable, as in the end it all alters how my results link back to my original prediction. The amount of solution in each tube varies slightly with every chip as I was only able to measure to the nearest millilitre, but this would not make a great difference to my results as the fluctuations would be so small it would hardly notice. However, even a small difference will affect my confidence intervals. The same applies to only being able to measure length to the nearest millimetre.
Reliability and Accuracy
I do not believe that my experiment was particularly reliable, considering the variation in results that I discovered. If I repeated my experiment, I would most likely find that my results were quite a lot different to before, regardless of whether the confidence intervals were improved of not. As there are so many extraneous variables involved in the experiment which were very difficult to control, the experiment would have needed to be repeated many more times to able to obtain accurate confidence intervals.