To reduce percentage errors comparatively greater amounts of syrup have been used as the uncertainties in the equipment will make up a less percentage error of a larger volume. I have disregarded calculating the value of steel as the uncertainties would play a major role instead I have just taken the accepted value (stated earlier). As previously stated the timing will not begin until the ball has travelled a few cm and is at terminal velocity this is because the equations will only work at terminal velocity and if this is not the case the results will not be very accurate. I would have liked to use larger distance for the ball to travel but with the equipment available this is not possible so these percentage errors will be greater than I would have liked. Ensuring the judgement of the ball bearings is at eye level is vital as this is the key measurement of the experiment as it has the greatest inaccuracy as human error will play a major role.
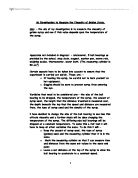
When the ball bearing is at its terminal velocity it must be at equilibrium with the forces acting against it all balanced. We know that weight will be the only force acting downwards whilst both the viscous drag and the up thrust will oppose this. So as the forces are balanced you know that weight=viscous drag+ up thrust.
You know that: - Viscous drag=6πrηv which is stokes law (where η is viscosity and v is velocity)
Weight=mg
And up thrust is equal to the weight of liquid displaced (In this case the syrup)
The weight of the syrup displaced can be found by using the density and then multiplying this by the volume of the ball bearing and by gravity this gives the equation, Up thrust=πr3ρg(where ρ is density is radius and g is gravity)
You then combine these equations in the format weight=viscous drag+upthrust to obtain the equation mg=6πrηv+ πr3ρg. By measuring all the unknowns bar η (coefficient of viscosity) I shall be able to rearrange the formula and find the viscosity.
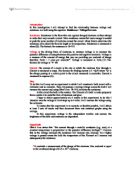
To calculate the viscosity a graph will be plotted using the graph stated above and sum rearrangement (shown below) you will see how the viscosity can be calculated from the gradient.
The mass of the ball bearings can be calculated by multiplying the density by he volume so put into the equation makes it become πr3ρsteelg=6πrηv+ πr3ρsyrupg. Cancel this down to
r2ρsteelg=6ηv+ r2ρsyrupg then rearrange this to leave 6ηv on its own.
r2ρsteelg- r2ρsyrupg =6ηv. Then make V the subject, V=g (ρsteel-ρsyrup). On the graph plot r2 on the x-axis and v on the y axis which means the gradient= (ρsteel-ρsyrup). Then rearrange this equation to make viscosity the subject η=x. So when the gradient is calculated you have an equation to use all the information to calculate the viscosity.
When this has been done for all temperatures one final graph will be plotted which will be used to compare all the viscosities at the various temperatures.
Results:
Density of syrup
20°C:
30°C
40°C
Anomalous results circled and not included in averages.
To find the velocity I have used the equation v= (where v= velocity, s= distance and t = time). The error (+or- value) is then calculated by working out a velocity for each result and taking the average velocity from this the error value is the greatest difference.
Using the formula and inputting the corresponding gradients I receive the following viscosities:-
20°C=194.96+or- 57.4Ns/m2
30°C=91.3+or- 22.8Ns/m2
40°C= 46.5+or=9.3Ns/m2
The relatively high errors on these could be down to a number of reasons over all I feel that temperature will have affected the results the most as it was the least accurate measurement made. For example the 20°C result has an error value of more than a quarter of the value stated this is massive thus showing the inaccuracy of the experiment. these results and error values will probably contain the actual result somewhere in there range bout where is uncertain due to the high amount of inaccuracy although I suspect it to be more close to the actual result as the error values are maximums. As the temperature was probably lower than that stated I feel that the viscosities are probably lower than theses stated. The inaccuracies and how they could have affected the results are discussed below.
Limitations and factors affecting the investigation:
Various things will have affected this investigation and increased the errors and reduced the accuracy. Afore mentioned is all the limitations from the measuring devices used and a brief guide how to obtain maximum accuracy from this equipment. But there is still much to take into consideration such as the fact that air bubbles will affect the viscosity or rather what the viscosity will appear to be. The air bubbles can effect the investigation in one of two ways or more commonly both thus making it impossible for me to determine what effect they have had on the investigation. On one hand you could say they would make the syrup appear less viscous as the ball bearings will travel with a greater velocity in air than they will syrup thus reducing the time taken for the ball bearing to travel the set distance which will make the syrup appear less viscous. But on the other hand the air bubbles being spherical and strong will have surface tension which the ball bearing will have to break through in order to travel through which will slow the ball bearing down thus making it appear more viscous. For the purpose of this investigation I am going to assume that these effects cancel each other out therefore having no effect. The limitations involved take into consideration what was a pretty poor procedure overall. Although he method was fine and effective some things could not be helped such as the temperature which was highly inaccurate thus meaning the values stated have an error value of +or-5°C as the temperature was read when the syrup was in the water bath but the procedure was carried out outside the water bath meaning the temperature would be less than that stated thus increasing the viscosity as I couldn’t keep placing the syrup back in the water bath after every ball bearing had been tested as this would be unpractical and in the time period it wasn’t feasible to do so. Also by the time a ball bearing had reached the bottom the temperature would have decreased thus making the test highly unfair. To try and counter this the temperature used at the stat was actually 3°C higher than that stated and was only allowed to drop around 3°C before being re-heated as this would decrease the viscosity of some meaning when the line of best fit was plotted it may be a better average and give a more true answer as to the viscosity of golden syrup. The fact that the water bath only came to round two thirds of the way up the measuring cylinder will not have an effect as the warmer syrup will travel to the top of the cylinder meaning all the syrup will arrive at the required temperature. The distances stated will be inaccurate as it is difficult to measure on the cylinder and difficult to get the pen to write once the surface had become wet meaning the viscosity could appear to be higher or lower than it actually is depending on whether the distance was shorter or longer than that stated. Also the ball bearing was not dropped in at the same place every time although the centre was aimed for, also it is hard to see if the ball bearing travelled in a perfect straight line as air bubbles may affect the direction slightly as the surface tension may force the ball bearing to travel round rather than through the air bubbles. This increase in direction would be highly difficult to measure as it would be so small but it would play a major role and reduce the accuracy significantly by making the viscosity to appear higher than it actually is due to the ball bearing travelling further than it has been stated.
Conclusion:
As far as I know I have discovered the viscosity of syrup which is what I set out to do. I have also seen how the temperature would affect this and as I thought and increase in temperature will lower the viscosity. This is due to the bonds in the syrup being weaker as there is more energy in the syrup due to more heat these weaker bonds allow the ball bearings to flow more freely through the syrup. The relatively high errors are due to the investigation being rather inaccurate due to the reasons discussed above.