Grass Cymbopogon
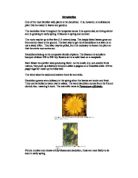
Grass is the common word used to describe green . The family (or Gramineae) are the "true grasses" and include most plants grown such as , for and (). They include some more specialized such as , as well as many plants. They also include plants often recognized to be grasses, such as , or some species of called .
Creeping Moss Selaginella
Genus of about 700 species of evergreen, rhizomatous perennials found in a range of habitats, from semi-desert to rainforest, mostly in tropical regions, with some species in temperate and alpine zones. Selaginella, or Creeping Moss, was a Victorian favourite. These tender, spreading perennials are grown for their pretty, scale-like foliage. They can be used for edging greenhouse benches, covering pillars, planting in hanging baskets and decorating terrariums. Most of these plants are found wild in tropical America and Asia, but some come from China, Japan, North America, South Africa and Australia. S. martensii is a pretty plant that grows up to 9 inches high and wide. Its tiny, glossy green leaves are produced in thick, multi-branched sprays.
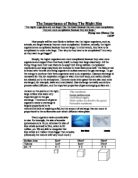
Biological Reasoning
Trampled diversity will be limited due to people stepping on vegetation therefore uprooting the vegetation. In addition, due to constant stepping on the footpath the constant pressure will make it hard for seedlings transferred by biotic (wind distribution) to penetrate the soil because it is so compact and therefore affecting diversity.
Secondly adaptations of pants/vegetation to withstand these conditions will increase or decrease the species diversity. An example of this is grass, grass produces more offspring than yarrow so I expect to find more grass than any other species on trampled and un-trampled land because more offspring (seeds) means more chance of surviving.
Finally un-trampled land will have a greater diversity due to it being untouched. This means it will not be affected by erosion as a result of walking hikers or compact soil.
Pilot experiment
The pilot experiment was carried out to determine whether the method planned worked effectively, and to decide the specific title of my coursework. Whilst I was conducting my pilot experiment I took samples from mown and grazed land and looked at the abundance of different grassland species. I felt that comparing the abundance of grassland species on mown and grazed land had already been done so I decided to compare trampled and un-trampled land. My pilot experiment also allowed me to determine the sampling size area of my experiment. I took 5 samplings from each of the mown and grazed fields. From my results it was clear that I did not collect enough data and therefore decided that to take 10 samplings during my real experiment. I initially planned to take 20 samples but I only had a limited amount of time to carry out my experiment before limiting factors affected my results.
Modifications
Having carried out the pilot experiment, a few changes were made for the following reasons:
Sample size- I decided that 5 samplings were too few and 20 was unrealistic due to limitations, so I decided to take 10 samplings. 10 samples should be enough to provide sufficient data representation and draw an accurate a conclusion and either accept or reject my null hypothesis.
Location- Location would be a major contributing factor in accepting or rejecting my null hypothesis. I decided to allow 20 meters before I took any samplings on trampled land due to the muddy patches that were present at the beginning of the field.
Methodology
Apparatus
-
Point quadrat - This will be used to measure the abundance of vegetation in the sampling area
-
Soil petrometer - To measure how compact the soil is in the sampling area
-
Key - To identify plants
-
Tape measure- To Identify sampling area
-
Ruler- To measure the distance between each point quadrat
-
Calculator - To calculate my stats test
Risk Assessment
While carrying out this experiment I took precautions to make sure this investigation was carried out safely. One risk is the weather and the possibility of different conditions throughout the day. Therefore I will wear adequate clothing while carrying out my experiment such as a warm waterproof coat and trousers. There is also the risk involved when using a point quadrat. The needle of the point quadrat is fairly sharp and therefore the needle will be handled with care. Finally I am carrying out my experiment on a used footpath used by vehicles and pedestrians. Therefore I must move off the footpath when a car is approaching. For ethical reasons I will take into consideration the environmentalists beliefs and will not uproot any plants.
Variables
Dependent – The abundance or diversity of grassland
Independent – Trampled and un-trampled land as this will be what I will change to compare the differences in abundance.
Controlled – One variable that was controlled was the time of day the experiment took place. Both areas were investigated during the same time of day. This was to ensure that the amount of sunlight and position of the sun were the same in both areas. This is important since sunlight affects plant growth and could potentially tamper with my results.
Confounding – Height of vegetation is one confounding variable as this may show a positive or negative correlation with the two sets of data. This is because the height of vegetation may show that different species are competing with each other. Organic content of the soil is also a confounding variable due to the fact that the grasslands may have different nutrients. This may have an effect on the growth of different species as it may require specific nutrients that may not be found in one of the grasslands. Another confounding variable is the pH of the soil. This is because the excretion of livestock may cause the soil to become slightly more acidic.
Method
Identify sampling site, i.e. trampled land. Set up a sample size by using measuring tapes. Systematic sampling should be used and whole transect will be an area of continuous vegetation with no mud patches. Each sampling should be 1.5 meters apart from the predeceased sampling. Set up the point quadrat and take 10 samplings. Lower the needle in place, if the needle hits a white clover, the white clover should be given a mark in the table, if it does not hit a plant do not record anything in the table. When the 10 samplings have been recorded turn the point quadrat 180 degrees. Repeat the process once more in order to make the data representative.
Repeat the process again on un-trampled land. Sampling on un-trampled land should be 4 metres adjacent to footpath samplings to make the data representative. When finished each sampling take the soil petrometer and take soil sampling. Make sure the ring on the soil petrometer is at 0. Take 10 samplings around each quadrat sampling. Push the soil petrometer into the soil and take the reading and record it into the table. This should be repeated at each quadrat.
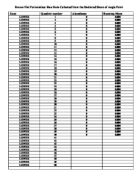
Results
Figure 2. Results Table for Trampled and Un-trampled Land - See attached Excel Spread Sheet
Figure 3.
Figure 4.
Statistics
In this investigation I will use the Mann Whitney test because the investigation is focused on different results obtained from different areas
Mann Whitney U Test
Sum of ranks along the row
Rank 1=55
Ranks 2=155
U1
U1= (U1×U2) + (0.5N2) (N2+1)-R2
= (10×10) + (5×11)-155
= 0
U2
U2= (10×10) + (5×11)-55
U2 = 100
U1 (55) + U2 (155) = 100
n1(10) × n2(10) = 100
U = 0, from the table, critical value (CV) = 10 at 1% significance level
U less than the Critical Value, therefore I reject my null hypothesis at the 1% significance level.
Figure 5. Man Whitney U Test Table
Figure 6. Running Mean – Un-trampled Land
Figure 7. Running Mean – Trampled Land
Conclusion
From the results, I can reject the null hypothesis and consequently accept my hypothesis; there is a difference in the abundance and diversity of grassland on trampled and un-trampled land at Nettlecombe in the month of March on and off a footpath.
The diversity in trampled land compared to un-trampled land differed immensely; this is clearly shown in the results table (see figure 2). The highest rate of diversity in un-trampled land was 2.83, while the highest rate of diversity in trampled land was 1.85. In comparison the lowest rate of diversity in un-trampled land and stood at 1.93. These figures highlight that un-trampled land had a greater diversity of grassland compared to trampled land. In addition, in un-trampled land the species richness was 5 while in trampled land stood at 4. These results show that the diversity and abundance of species is affected by trampling of the soil. Furthermore from the results I can conclude that the density of the soil affected the abundance of grassland in un-trampled and trampled land. The results show that in un-trampled land the soil was less compact than in trampled area. For instance in un-trampled land................
Overall the results proved accurate and reliable and I was able to accept my hypothesis at 1% since the result of the Mann Whitney U test was 0. The reliability of the results is also supported by the fact that I was constantly checking the diversity. In addition, the Mann Whitney U test confirmed the significance of the difference between the two data sets. At 1% significance levels the U value was less than the critical value this meant the hypothesis was correct.
There are various explanations as to why there was a greater abundance of grassland in an un-trampled area than a trampled area. The confounding variables played a large part in the reasons as to why these results may come about. Since the confounding variable is an extraneous variable in a statistical model that correlates (positively or negatively) with both the dependent variable and the independent variable.
From looking at my results it could be argued that cofounding variables played a part in the outcome of the results. Therefore, while carrying out the investigation I measured the compactness of the soil. The compactness of the soil provided different results due to un-trampled land being unspoilt by pedestrians etc, and trampled land being frequently used. Therefore, trampled soil will tend to be more compact, and this will have an effect on the amount of nutrients in the soil leading to a decrease in the abundance of grassland in the area.
Finally, competition may also explain why there is a difference in abundance between the two grasslands. Un-trampled grassland had been untouched and therefore there is competition between different species. In addition, un-trampled grassland has taller vegetation in comparison to trampled grassland. This may be due to their exposure to more sunlight and the fact that grassland in a trampled area is constantly stepped upon and therefore the stem of the flower may break losing its support and height.
Evaluation
Throughout the duration of the experiment I was lucky enough not to obtain any anomalies due to consistent weather conditions and the land amount of land available to me to carry of the experiment. Precaution and care were also taken while obtaining the data. However I believe the experiment could be improved through the methodology and more samplings could have been taken. Even though my 10 samplings were sufficient to make my data representative, and enough to accept my hypothesis, ideally I would have taken 20 samplings. 20 samplings would have further confirmed the results beyond doubt.
Bibliography:
J. Adds, E. Larkcom and R Miller (2001) Genetics, Evolution & Biodiversity (Nelson Advanced Science)
Wikipedia
J. Adds, E. Larkcom and R Miller (2001) Genetics, Evolution & Biodiversity
J. Adds, E. Larkcom and R Miller (2001) Genetics, Evolution & Biodiversity
J. Adds, E. Larkcom and R Miller (2001) Genetics, Evolution & Biodiversity
J. Adds, E. Larkcom and R Miller (2001) Genetics, Evolution & Biodiversity
J. Adds, E. Larkcom and R Miller (2001) Genetics, Evolution & Biodiversity
J. Adds, E. Larkcom and R Miller (2001) Genetics, Evolution & Biodiversity