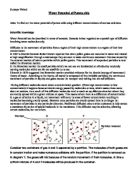
As more and more water flows across the partially permeable membrane pressure builds up in the solution. This is osmotic pressure a solution with low water potential has a high osmotic pressure. If pure water were on both sides of the membrane, the osmotic pressure difference would be zero. But if normal human blood were on the right side of the membrane, the osmotic pressure would be about seven atmospheres!
Diagram summarises the conditions on the two sides of a partially permeable membrane, and the terms used to describe them. The large black blobs represent sucrose molecules; the smaller white circles represent water molecules.
Osmosis can occur in cells. If a cell is surrounded by pure water, or a solution whose solute concentration is lower then that of the cell’s contents, water flows into the cell by osmosis and the cell swells up. This is case the water potential of the external solution is higher, and the osmotic pressure lower, then the solution inside the cell.
On the other hand, if the cell is surrounded by solution whose solute concentration is greater than that of the cell’s contents, water flows out of the cell and the cell shrinks. In this case the water potential of the external solution is lower, and the osmotic pressure higher, than the solution inside the cell.
Finally if the cell has the same solute concentration as the surrounding solution, there will be no net flow of water into or out of the cell. In this case the external solution has the same concentration as its surrounding concentrations.
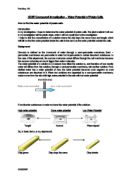
Osmosis can occur in both plant cells and in animal red blood cells. The diagrams below show the effect of osmosis in both plant and animal blood cells.
For my scientific knowledge I have used the following books Biology Principles and processes by Michael Roberts, Michael Reiss and Grace Monger, Biology a functional approach by M B V Roberts, Advanced biology principles and Applications by C J Clegg with C G Mackeam and Advanced Sciences biology 1 by OCR. I also used this website for some of the diagram used www.Hyperphysics.com. I thought all the information I have gained and used had good terminology to explain the theory of osmosis, water, pressure solute potential. Also they all provided and agreed with the same theory.
Prediction
My investigation is to find out the water potential of potato cells using different concentrations of sucrose solutions. Using my scientific knowledge I can predict that the concentration of the sucrose solution decreased in molarity the mass of the potato chip will increase in mass. If the sucrose concentration is lower than that of the cell sap then the water potential of the solution inside the cell is lower then that of the sucrose solution outside the cell and the osmotic pressure higher then the sucrose solution outside the cell. There fore this means the water potential of the sucrose solution outside the cell is higher then the solution inside the cell and the osmotic pressure lower. This is caused due to the water entering the vacuole of the cell by osmosis causing the vacuole to expand which pushes the cytoplasm outward causing the cell to turgor and therefore gain mass. So therefore if the sucrose concentration is greater than that of the cell sap then the water potential of the solution inside the cell is higher then that of the sucrose solution outside the cell and the osmotic pressure higher then the sucrose solution outside the cell. Therefore this means the water potential of the sucrose solution outside the cell is lower then the solution inside the cell and the osmotic pressure higher. This caused due to water leaving the vacuole of the cell by osmosis causing the vacuole to shrink which pushes the cytoplasm inwards causing the cell to plasmolyse and therefore lose mass. During the experiment at some point equilibrium will be reached when water potential in one region is the same as the other. There will then be no net movement of water molecules.
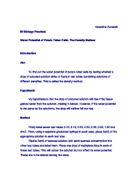
An experiment by Roberts, Reiss and Monger result shown below determine the water potential of potato tuber cells. The experiment involved samples of tissues which were placed in series of sucrose solutions of different molarities, and the change in mass measured. The concentration of sucrose causing no change in mass shown by the graph has a molarity of 0.27M. If this converted to the corresponding pressure reading using suitable table, the value of the water potential of the potato tissue can be found. I will use the results of my investigation to investigate whether this theory and the result of this experiment is correct.
Variables
The independent variable of my experiment will be the concentration of the sucrose solution as I will be changing the molarity of the sucrose solution because I will be using six different ranges of concentration of the sucrose solution.
The dependent variable of my experiment will be the mass of the potato chip, as I will be measuring if the potato chip has gained or lost mass to determine the water potential.
My controlled variable of my experiment are temperature of the sucrose solution, surface area of potato, best time to leave the chips in solutions to determine the steepness of the concentration gradient and the best species of potato to use to determine the nature of the molecules and ions. These are the controlled variables in my experiment as they must be kept constant during the experiment; otherwise they can cause unreliable results, which could lead me to the wrong conclusion and also leading me to believe that the result of Roberts, Reiss and Monger’s experiment is incorrect.
These factors could determine incorrect results because:
Temperature: at high temperatures, the molecules and ions have much more kinetic energy than at low temperatures. They move around faster, and thus diffusion takes place faster.
Surface area: the surface area across which diffusion is taking place. The greater the surface area, then the more molecules or ions can cross it at any one moment, and therefore the faster diffusion.
The steepness of the concentration of the gradient, that is the difference in the concentration of the substance on the two sides of the surface. If there are for example, many more molecules on one side of the membrane than on the other, then at any one moment more molecules will be moving (entirely randomly) from this side than from the other. The greater the difference in the number of molecules passing in the two directions, and hence the faster the net rate of diffusion.
The nature of the molecules or ions: large molecules require more energy to get them moving small ones do, so substances with large molecules tend to diffuse more slowly than the ones with small molecules. Non-polar molecules diffuse more easily through cell membranes than polar ones, as they are soluble in non-polar phospholipids tails.
The best time to leave the chips in solutions: if the time is not kept constant then it will be very hard to determine the equilibrium at which the osmotic pressure and the water potential are equal. This is because more water will enter the vacuole of the cell sap if left in sucrose solution for too long resulting in full plasmolysis or full turgor.
Pilot Run
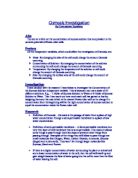
For my pilot run I have investigated the best surface area of potato. I have used the following method and apparatus to investigate the best surface area. I used 6 ranges of different size of cork borer which were 1, 3, 5, 7, 9, and 11.
- I first got 6 plastic tubes ready with lids
- Poured 30ml of distilled water in each tube using a syringe to
- Cut 1 piece of potato from each sizes of cork borer
- Measured 3cm of each potato using a ruler
- Then I cut each piece of potato using scalpel on cutting tile
- Weighed the initial mass of each of potato chips using electronic balance to 2 decimal places
- Labelled each plastic tube with the potatoes size
- Put potato into the tube
- Then I left the tube for 24hours so osmosis can occur
- Removed excess water using tissue paper
- Reweighed mass of each potato chips using the same electronic balance to 2 decimal places
- Then recorded the result.
I then used the following results shown bellow to choose the best surface area of potato for my investigation.
Initial Mass (g) Final Mass (g)
To find the best size for surface area of potato chip I calculated the % change in mass for each of the sizes of cork borer using the following calculations:
% change in mass
% change in mass = Change in Mass x 100
Original mass
Risk Assessment
During the experiment safety is very important. Although concentration sucrose solution is not very hazardous it is very important to wear goggles in case of spillage of solution which could enter the eye. Also making sure all tools are tucked under table as this could cause injury by tripping over and breaking glass or any hazardous equipment e.g. scalpel. Handing scalpel and crock bored very important as they can cause injury if not handled correctly. Using cutting tile was another way to prevent the hazard of any injury e.g. cutting of finger by slipping caused by a spillage of solution.
Conclusion
Looking at the table showing percentage change in mass I can see that size 5 has the greatest change in mass therefore I can use this size of cork borer for my investigation as it should give reliable result because of the greatest change in mass. The gain in mass shows osmosis was taken palace. During osmosis water entered
the vacuole of the potato cell causing it to expand pushing the cytoplasm outwards causing the cell to turgor and therefore gain mass as a result. Therefore this shows that size 5 surface area has big enough surface area where enough amount of molecules or ions can cross it at any one moment causing diffusion to occur
For my independent variable which is the molarity of the sucrose solution I will use the following ranges of molarities of sucrose solution 1.0M, 0.8M, 0.6M, 0.4M and 0.2M. I have chosen the following ranges of concentration of the sucrose solution because from my scientific knowledge I found out that the experiment carried out my Roberts, Reiss and Monger showed the equilibrium at 0.27M. Using these ranges of concentration I can carry out the investigation to see if the result of the experiment was correct, as 0.27M fits in between the ranges I have chosen.
Apparatus
- Cork borer – to cut out the size of potato chip into cylinder
- Plastic tube with lid – to stop evaporation and place potato chip into sucrose solution
- 30ml syringe – to measure the volume of sucrose solution
- 15cm ruler – to measure the length of potato chips to 3cm each
- scalpel – to each of potato chip in the same length
- electronic balance to 2 decimal places – to weigh the initial and the final mass of each potato chips after and before the experiment
- cutting tile – to cut the potato chips on
- Thermometer – to measure the temperature of sucrose solution
Method
- get 6 plastic tubes ready with lids
- measure the temperature of sucrose solution to 20°C using a thermometer
- Pour 30ml of distilled water in each tube using a 30ml syringe
- Cut 1 piece of potato from each sizes of cork borer
- Measure 3cm of each potato using a 15cm ruler
- cut each piece of potato in the same length of 3cm using scalpel on cutting tile
- Weigh the initial mass of each of potato chips using electronic balance to 2 decimal places
- Label each plastic tube with the potato’s size
- Put potato into the tube and place lid
- Then leave the tube for 24hours so osmosis can occur
- Remove excess water using tissue paper when 24hours is over
- Reweighed mass of each potato chips using the same electronic balance to 2 decimal places
- Then record the result.
For the controlled variable I will be using 20°C for the temperature of the sucrose solution as this is easy to control as this is around room temperature. For the length of time to leave the chips in the solutions it will be 12hours. I decided to decrease the length of time used from the pilot run because of the different range of sucrose solution being used. During the pilot run it was only pure water however now it is sucrose solution which increases in concentration. For the best surface area I will be using cork borer size 5 as from my pilot test I have found out this was the best surface area to use because of the percentage change in mass. To make this experiment as reliable and valid as possible I will keep the entire controlled variable constant during the experiment so these factors do not effect the end result of my experiment
To make my result as accurate as possible to prevent any anomalous result I will weigh the mass of initial and the final mass using the same electronic balance to 2 decimal places. Also I will use 5 different ranges of concentration of sucrose solution with 3 repeats to prevent any anomalous results.
When results are gained after the experiment I will use the following reference graph to find out the water potential of the solution that causes no change in mass.
To analyse if Roberts, Reiss and Monger experiment result was correct I would have to find the percentage change in mass using the same formula as before and plot a graph similar to the one shown thin their experiment to compare the results. This will also show how accurate and valid my experiment was and what might have gone wrong during the experiment if the results are not as accurate and valid as their experiment.
.