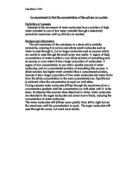
Cell wall Cell membrane
Vacuole
Tonoplast
Nucleus
Outside solution has entered cell
A plasmolysed cell is the opposite of a turgid cell. As you see in the above diagram, the membrane is no longer pressed against the cell wall and this is because there is not enough ‘turgour pressure’ to do so. There is less water in the cell which has also made the vacuole shrink. Because it is the cell membrane which is the partially permeable membrane, the outside solution has moved through the cell wall and into the cell.
Preliminary experiment
I will do a preliminary experiment so that before my real experiment so that I will be able to familiarise myself with the procedures. It will also enable me to predict an approximate result for the amount of sucrose concentrated in a potato cell. It will therefore allow me to choose what I think will be the correct concentrations for the real experiment.
The preliminary will give me a result for the concentration of sucrose in a potato cell and therefore I will be able to look back and compare my real experiment with my preliminary. It may help me spot any errors I make.
Method
Using a cork borer, I will cut out two potato cylinders. I will then take measurements of their length to the nearest mm using a ruler. I will then place one in a specimen tube filled with 20cm3 of 0.0M sucrose solution and the other in a specimen tube filled with 20cm3 of 1.0M sucrose solution. I will leave them for 30 minutes then measure them again to the nearest mm using a ruler. I will note down the results.
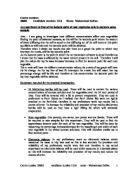
Results
I have also included a graph showing the results and from it I can gather that the point of incipient plasmolysis is 0.33, meaning that the concentration of sucrose in my potato cells was 0.33M.
Although I felt that my preliminary experiment went fairly well it is difficult to tell how accurate it is without doing more experiments at different concentrations and also averaging. From my preliminary I learnt to place a piece of tissue paper on the scales to soak up excess water so that it does not interfere with the mass measurement.
I do feel however that measuring the length of the potato chips is not a precise enough measurement because it is only measured to the nearest mm and does not take such things as the impact of swelling into account. Using a ruler to measure also invites human error to occur. Therefore I will stick to measuring the mass of the cylinders in my real experiment using a scale which measures to 0.01g. Measuring the mass is better than measuring the length because you can take into account swelling and also the scale which I will be able to use is far more accurate. I will also leave the cylinders for longer so that there is more time for osmosis to occur. In my real experiment I will use five different concentrations of sucrose solution and use three vegetable cylinders in each for a more accurate result.
Hypothesis
Taking into account my preliminary experiment and also my research into osmosis, I have come to the conclusion that the potato chip in a low concentration of sucrose such as 0.0M or 0.25M will increase in mass because the concentration of sucrose inside the cell will be higher. However in a higher concentration of sucrose such as 0.75M or 1.0M it will decrease in mass because the concentration of sucrose inside the cell will be lower. Taking into account my preliminary experiment I would believe that the concentration of sucrose inside the potato cells would be approximately 0.3M. Regarding the carrot experiment, in theory the same sort of result should occur. However as carrots are much sweeter to taste than potatoes, this signifies a higher sucrose concentration within the cells. Therefore I would assume that the concentration of solutes within the carrot cells to be in the range of 0.5 to 0.8M. I cannot be as precise with the carrots because I have not done a preliminary experiment. I am relying upon my knowledge that carrots are sweeter than potatoes but 1.0M is excessively sweet, and therefore it would be highly unlikely that carrots would be sweeter than 1.0M.
Also, taking into account my preliminary experiment, I chose the five concentrations of sucrose that I will use in my experiment. These will be 0.0M, 0.25M, 0.5M, 0.75M and 1.0M. I chose these concentrations because I showed in my preliminary that a probable concentration of sucrose in the potato cylinders is 0.3M and therefore my range will not go beyond 1.0M. Although I do not know what concentration of sucrose in present in carrots, I do not expect it to exceed 1.0M. Therefore I have chosen my concentrations to be between 0.0M and 1.0M.
Method
My method will be the following:
- The ends will be cut off the potatoes and carrots using a clean knife whilst they are placed on a clean tile.
- Using a clean size 2 cork borer, 15 potato cylinders will be cut.
- Using exactly the same size cork borer, 15 carrot cylinders will be cut.
- Both the potato and carrot cylinders will have their masses measured and an exact note of which cylinder is which will be made.
- For both the cylinders of carrots and potatoes, each will be divided into five groups of three and the masses of the three will be added together.
-
Each of the ten specimen tubes will be filled with 20cm3 of the desired concentration of sucrose solution.
- A label will be stuck on each and the concentration written on it of the sucrose solution it contains together with the combined and separate masses of the three cylinders.
- The group of specimen tubes will be put in the fridge, so that they are kept at a constant temperature and away from the dangers of microbes, at the same time and retrieved 24 hours later.
- After 24 hours, the cylinders will be taken out
- The cylinders will be blotted using a piece of tissue paper laid on the scale, and will then be weighed using a scale to the nearest 0.01g.
- A note will be made of the mass of each and which concentration of sucrose it was from.
- The results will be recorded and the averages and percentage increase worked out because percentage increase is the most accurate way of measuring a difference in mass as the masses were not all the same at the beginning.
Here is a list of the equipment which I will use for each experiment:
- Three cylinders of either carrot or potato
- A specimen tube
-
20cm3 of the desired concentration of sucrose solution
- A pipette
- A measuring cylinder
- A label
- A size 2 cork borer
- A knife
- A tile
All together I will have used one of each of the above apart from
- 10 specimen tubes, one for each separate experiment.
- 15 potato cylinders, three for each of the five potato experiments.
- 15 carrot cylinders, three for each of the five carrot experiments.
- 10 labels, one for each specimen tube.
Fair Test
As I only want to take measurements of the change in mass of the cylinders in accordance to different concentrations of sucrose solutions, all other factors must be kept constant. This means that I will have to make sure that the amount of sucrose concentration will always be 20cm3, measured with a pipette and a measuring cylinder. I have to take care cutting out the cylinders so that none of the vegetable skin is left on as it is waterproof and would prevent osmosis from occurring. The experiments will both be carried out at a temperature of around 2 or 30C, as I will leave the specimen tubes containing the cylinders in the fridge overnight. Although I plan to carry out the experiments on different days, I have ensured that I will be able to carry out each experiment over a period of 24 hours, giving the osmosis sufficient time to take place. I will also be using the same equipment to do each experiment, but cleaning each one before using it again. However I will of course not be using the same cylinders because the cells cannot hold more than a certain amount of water, or the containers because then the experiments would take far too long. All my containers will be the same size and each with the same sealed lid. I will do each experiment three times (three cylinders per container) so that I can take an average and thus obtain a more reliable result than if I were to take only one measurement.
After the experiment I must weigh each cylinder so that I can record the percentage increase of the mass. When doing this I will place a paper towel beneath the cylinder to soak up any excess water. I will also reset the scale to zero after weighing each cylinder and also after I have placed the paper towel on the scales, so that the weight of it is not recorded in my results.
Safety
I need to ensure that my experiment will be carried out safely. On the whole the substances which will be used are not dangerous, however the sucrose is rather sticky and for this reason I need to wear a lab coat over my uniform to protect from any spillages. On this basis I will also make sure that any books and papers are well out of the way of my experiments. Also, the one dangerous piece of equipment which will be used is the knife so I just need to take care when using it, and also cut up the potatoes and carrots on a tile, to avoid cutting the bench.
Obtaining Evidence
I did the experiment in accordance with my method, and here are the results that I obtained:
Potato Experiment:
Carrot Experiment:
The masses of the carrot cylinders prior to the experiment
The above tables show the results I obtained from doing my experiment. Also included is a graph showing the percentage differences of the potato cylinders in the relation to the sucrose concentration and also the percentage differences of the carrot cylinders in the relation to the sucrose concentration. Both the results of the carrot and potato experiments are plotted on the same graph, as I need to compare them in my analysis.
Analysis
From the results on the graph I can read the point of incipient plasmolysis for the potato and carrot cells.
- For the potato cells the point of incipient plasmolysis is 0.27M
- For the carrot cells the point of incipient plasmolysis is 0.80M
In accordance with my research, this means that at the point of incipient plasmolysis, the sucrose concentration inside the cell is equal to the sucrose concentration outside in the specimen tube. This is because the net movement of water molecules is equal in both directions across the cell membrane, which in effect means that there is no change in water levels, and therefore mass level of the cells.
These readings indicate to me that the average sucrose concentration in a potato cell was 0.27M whilst the average sucrose concentration in a carrot cell was 0.80M.
The results and the graph also support various points in my original hypothesis. I had stated that I expected the sucrose concentration in the carrot cells to be higher than those in the potato cells, and as you can see clearly from the graph, I was correct.
I estimated the sucrose concentration in potato cells to be around 0.30 which was extremely close to the real experiment where it turned out to be 0.27. However I underestimated the sucrose concentration in carrot cells as I had thought it to be around 0.6M. As I had done no preliminary experiment involving carrots, this was simply a prediction based on my knowledge that carrots are sweeter than potatoes.
The reason as to which the mass increased in the lower concentration was because the cell membrane lets in water due to osmosis so that the concentration of water molecules in the sucrose concentration and within the cell are equal. As the cell takes in water, the mass of the cell therefore increases. The reason as to which the mass decreases in the higher concentrations is because the cell membrane lets out water as the concentration of solutes within the cell and the sucrose concentration attempt to balance themselves due to osmosis. This leads to water passing out of the cell and therefore lowering its mass.
Evaluation
I think that on the whole my experiment went very well as the results tied in with my research and hypothesis. The only debatable issue I think is the fact that not all my points were as near as they could be to the line of best fit. The one really noticeable point on the graph is for the potato experiment where at 0.5M, the point on the graph is quite far beneath the line. However I did consider calling this point anomalous and therefore not counting it, but reconsidering I felt that it wasn’t so far off the line that it couldn’t or shouldn’t be included. On the whole the points on the graph for my carrot experiment are near enough to the line of best fit and I am happy with that.
I felt that I was accurate when it came to weighing the cylinders because I did work on a measurement correct to 0.01g. Although it is quite hard to tell, I think that on the whole my experiment was reliable because the masses of the cylinders had quite a small range, when you compare the individual percentage increases. This means that the more similar readings you obtain, the more reliable the result will be.
Reflecting on the experiments, I feel that I did as well as I could possibly have done but I must also allow for some human error, as it is very probable that I was at fault for some of the inaccuracy. It is also possible that the concentrations of sucrose were mixed up slightly imprecisely, as that was also done by a human being. However I do believe that if anything then it is because different parts of the potatoes and carrots grew differently and of course I had to use more than one potato and carrot and they had different concentration of solutes within their cells. Although I tried to overcome this factor by using potatoes and carrots of the same brands each and every carrot and potato is slightly different from the next. It is also possible that I left some small pieces of skin around the potato, which means at that particular point no water can be absorbed. This results in that particular potato cylinder absorbing less water, hence less osmosis occurring than in another place. This would also create an artificially low reading for than particular potato cylinder.
If I were to try and improve on this experiment, I would have to use more cylinders because then I would gain a more accurate and reliable average. Also I could use more concentrations of sucrose, perhaps 0.0M, 0.1M, 0.2M etc. This would enable me to plot a more accurate graph as well and therefore get a more precise measurement for the point of incipient plasmolysis.
If I were able to do further investigations into osmosis, I would like to experiment with the factors that effect osmosis, for example the length of the membrane and the temperature of the water. In order to test one of these I would have to keep the concentration of the sucrose solution constant and have one of the above as the variable. I am particularly interested in this because I feel I have only done a part of a bigger experiment; I have only tested one of the factors so far which is the concentration of the solution.