- Measure volume of oxygen bubbles produced after 180 seconds.
- After 180 seconds measure volume of oxygen on scale.
- Experiment repeated three times to find average reading.
The desired pH value for each test tube is obtained by adding a buffer solution at the desired pHs. I found during the course of this experiment, during the preliminary experiment, that just by adding acid cannot give an altered pH, but only acidify solution it is added to the specific pH of the acid.
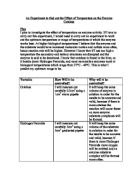
Risk assessment
Results may not be specific enough, so after average reading from first experiment was taken, I should like to carry out the experiment again at more specific pH, i.e. if the optimum pH for catalase is found to be pH7, then repeat at pH 6.6, 6.8, 7.0, 7.2, 7.4. It is possible that the buffer solutions were not exactly to the pH stated which would effect my results. Also, the size of the oxygen bubbles will effect the reading against the scale of the test tube.
The preliminary experiment carried out was successful, and a control where the pH was not altered, was also used to make sure that the change in volume of oxygen produced was due to the altered pH. During the preliminary experiment 40mm of oxygen was produced. Averagely 24mm of oxygen was produced.
Results: (mm rise)
Trends and Patterns
My data was slightly inconclusive, The graph shows a dip at pH6, not in correlation with the other pH results. The first attempt appears to show this most. The main trend with exception of pH6 shows a positive correlation meaning averagely, mm of oxygen increases with increasing pH to the extent of the performed experiment; roughly by 10mm.
Anomalous Results
The main anomalous result was at pH6 – the graph should have shown a positive gentle curve. This could be due to the pH6 buffer solution being contaminated and therefore its pH may have been altered.
On the first attempt, if the trend of a positive gentle curve is followed; pH4 should have produced more oxygen. Instead of giving 28mm, I estimate 35mm to be more conclusive. pH5 in the first attempt was high in relation to the received results for every other attempt.
Conclusion
The alternative hypothesis was proved correct, with increasing pH an increasing amount of oxygen was produced.
Explanation of Conclusion
If I exclude the anomalous result of pH6, I have found that the enzyme catalase favours and alkali pH for maximum rate of activity.
The optimum pH for catalase is pH8. The rate of activity decreases with decreasing pH as explained in the hypothesis; the high concentration of H+ ions in the solution act to denature the enzyme at very low pHs but begin to effect the active site and change its shape. This is because the attraction between substrate and enzyme is often a result of small electric charges at the active site, and these are disrupted by changes in H+ ion concentration. The high concentration also changes the charge on the alkyl group meaning the substrate cannot fit into the active site according to the ‘lock and key’ theory of enzyme activity:
With increasing pH, the more alkali the buffer solution added to the yeast, the higher the concentration of OH- ions which also change the charge on the R-group and change the shape of the active site. Since hydrogen peroxide is decomposed into oxygen and water, (water is made up of OH- ions and H+ ions) the relative optimum pH is alkali at pH8.
Critical Analysis
My results were variable and on occasion inconclusive. This could be due to many factors, namely; contamination of buffer solution, test tubes, beakers and pipettes. Although extreme caution was taken to avoid this human error must be taken into consideration. Since three hours was only spent on this practical, more time may have produced more accurate findings.
The experiment was given 180 seconds to occur, and it is possible that after a longer period of time, perhaps between 5 and 20 seconds longer, more oxygen may have been produced giving more reliable results. Also, if experiment was repeated in closed surrounding rather than open surroundings, less oxygen would have been given off to the surrounding during the time taken to read the scale and measure the volume of oxygen produced.
The experiment was performed under standard conditions, 250C and 1 atm, but the room temperature may have altered during the course of the experiment and as an increase in temperature increases the rate of reaction this may explain for the increase in volume of oxygen produced as each attempt was performed.
Limitations
The experiment was repeated three times and an average reading was taken. The experiment would have shown better results if the experiment was repeated more times, e.g. 5 times. The experiment was completed at a range of 5pHs, pH4-8. I couldn’t continue the experiment to ph above 8 to show the peak pH and at what level catalase becomes denatured as a buffer solution above pH8 was not available. Below pH4 the enzyme would have become denatured, which could be concluded from the experiment as buffer solution to ph below 4 was also not available.
In the experiment, a ratio of 1:1 yeast: hydrogen peroxide was used, a higher volume of enzyme to substrate would have increased the rate and vice versa. The size of the test tubes determined the volume of substrate / enzyme that was appropriate to use as room for oxygen bubbles was needed.
A strip of graph paper was used at 2mm intervals to calculate the amount of oxygen produced. Therefore the results read from the graph paper could have only be to a degree of accuracy in accordance to that of the graph paper itself. As a different strip of graph paper for each test tube was needed, errors could have occurred in my readings.
As only three hours was allocated for the experiment, sufficient time may not have been given for the reaction to occur to achieve valid readings of oxygen produced.
Further work required
The investigation may have been improved in many ways, e.g. The investigation may be furthered by continuing the experiment to smaller intervals of pH, 6.5, 7.0, 7.5, 8.0 and continued until an exact optimum pH for the enzyme catalyse was deduced.
Repeating the experiment to smaller and larger time intervals may increase validity of results, e.g. 60seconds and 230 seconds.
During this experiment the effect of pH on the enzyme catalase was overall successful, all controllable variables excluding pH were kept constant. Increasing the ratio of yeast to hydrogen peroxide would alter results as altering enzyme and substrate concentration effects the rate of reaction. If repeated again, changing the concentrations also may show more conclusive results as having the enzyme in excess would give an optimum reaction rate and therefore more accurate results.
The surrounding of the experiment were open, meaning more oxygen than necessary could diffuse into the atmosphere. Repeating the experiment in closed surrounds would eliminate marginal error to improve results. This was unfortunately not realistically possible. Care was taken to avoid contamination of apparatus, but sterilised, different apparatus for each repetition would insure more accurate readings.
Safety was taken into account, and care was taken when handling the substrate and enzyme solution.
The experiment was overall successful, although slightly inconclusive, since the optimum pH was established as pH8, even though this was not the highest pH used in the experiment.
Overall the results were accurate, in relation to the variability of components used in the experiment. I proved my alternative hypothesis be correct.