Method for Preliminary Experiments
It is the time taken for the presence of starch from the solution to be removed that was measured. This can be found by testing the reacting solution at regular intervals with iodine solution. If starch is present a blue-black colour is seen. However when all the starch has been hydrolysed, the original yellow colour remains unchanged.
In the first set of preliminary results the volumes of reagents was varied to find a suitable time period over which the reaction would occur. Techniques and preparation procedures were also tried and tested.
Once this was found a more detailed experiment to identify general trends when the concentration of chloride ions is varied took place. This allowed the range of readings to be taken to be identified.
List of Reagents and Equipment
Equipment
- Beakers
- Test tubes
- Pipettes, 1 ml
- Pipettes, 10 ml
- Thermometer
- Graduated cylinders
- Stop watch
- Boiling tubes
Reagents
-
Mammalian salivary amylase - 100cm3 of 1% solution
-
Starch solution - 100cm3 of 1% solution
- Sodium Chloride (solid) - (to be made up to required concentrations)
- pH 7.2 buffer solution
- Iodine reagent stock solution
Preliminary Method
2cm3 of the 1% starch solution was measured out in a test tube using a graduated pipette (10ml). The starch solution was made using soluble potato starch, a solution was saturated with starch and then diluted to a 1% solution.
In a second test tube 2cm3 of the 1% amylase solution was measured out in a test tube using a graduated pipette (10ml). This was made up in the pH 7.2 Buffer which had been acquired to that specification. The amylase was dissolved in this to the point of saturation. This was then diluted to the 1% required.
2cm3 of sodium chloride solution was measured out in a test tube using a graduated pipette (10ml) at the required concentration was mixed with the amylase. The sodium chloride solution was made up by measuring out 10 cm3 of pure water (distilled) and then adding the required mass of solid sodium chloride (measured using a balance accurate to 2d.p) to make the solution up to the required molar concentration. (at 0.00 mol.dm3 no sodium chloride was added)
Both test tubes were then placed in the room temperature water bath for a minimum of 5 minutes. This was found from preliminary work to allow any difference in temperature to be eliminated.
The two solutions of amylase and starch were then mixed in a boiling tube. The timer was started at the point of mixing. At 15 second intervals a small quantity of the reacting solution was removed from the test tube and tested with a small quantity of iodine solution on a spotting tile. The colour change was then recorded This was continued until there is no change in the colour of the iodine solution (no starch present) The time at this point was then recorded. This was repeated another 2 times to produce an average. This in turn was then repeated for concentrations of chloride ions 0.05 mol.dm3 intervals until four identical endpoint had been recorded (e.g. 75 seconds). Further more the entire procedure was repeated to allow an average of two endpoints to be calculated for each concentration of chloride ions.
The control for this experiment will be when no chloride ios are present in solution. The reaction velocity can then be calculated at each concentration using the following equation:
The rate can then be represented as a fraction of the active sites that are bound by substrate (Fes). That is taking the maximum rate to be when all active sites are saturated.
Control of Key variables
The key variables elaborated below must be controlled to allow conclusive evidence on the effect of chloride ions. i.e. If a second variable is changed then it is impossible to identify the effect of a single variable. Hence the results are void.
The pH of the solution must be maintained and variations between experiments eliminated. This can be achieved using a buffer solution at pH 7.2 as α amylase’s optimum pH is very slightly alkaline. The pH affects the reaction velocity by ionisation of the side chain when the pH varies from it’s optimum. This changes the shape of the active site, and high or low pH causes the enzyme to denature.
Amylase concentration must remain the same for each experiment. This can be achieved using a fixed volume of a set concentration of amylase in each experiment. This must be maintained as an increased/decreased number of enzymes in solution will cause an increase/decrease in reaction velocity irrespective of whether they are in the R-state or T-state.
Initial starch concentration again must be maintained for each experiment. As above a change in starch concentration will change the rate of the reaction due to an increased number of collisions between enzyme and substrate. A set volume and concentration can be used to maintain this variable.
Temperature will be kept at a constant and known level throughout all the experiments. This can be done by placing the test tubes of enzyme and substrate in a water bath which is at room temperature. The high specific heat capacity of water will compensate for any small changes in room temperature that occur during the experiment. The test tubes will be left in the water bath for a minimum of 5 minutes prior to the beginning of the experiment. The effect of temperature is to increase the kinetic energy of the enzyme and substrate thereby increasing the number of successful collisions and increasing the reaction velocity. Hence it must be kept constant.
No inhibitors / other promoters will be used . N.B. Heavy metal ions (group 2) and halide ions can act as activators and so the pH buffer solution should not contain these ions.
Risk Assessment
- Lab Coat and Goggles to be worn AT ALL TIMES during the experiment
- All substances must be in clearly labelled bottles
Starch solution
very low risk, should be kept in labelled container
Amylase
Precautions:
Avoid inhalation in powder form
Avoid contact with eyes.
Wash thoroughly after handling.
First Aid:
In case of eye contact, immediately flush eyes with plenty of water for at least 15 minutes. Seek medical attention if irritation develops or persists
Sodium Chloride solution 2%
Causes Eye Irritation
Precautions:
Avoid contact with eyes.
Wash thoroughly after handling.
First Aid:
In case of eye contact, immediately flush eyes with plenty of water for at least 15 minutes. Seek medical attention if irritation develops or persists
Iodine potassium iodide
Toxic and Irritant
Precautions:
Avoid contact with eyes.
Avoid direct contact with skin
Only use small quantities at any time
First Aid:
In case of eye or skin contact, immediately rinse with plenty of water for at least 15 minutes. Seek medical attention if irritation develops or persists
Glassware
Precautions:
As glassware will be used, the up most care to prevent breakage will be taken. This includes never placing cylindrical glassware on the bench where it is able to roll off. If glassware is broken then it should be cleared using appropriate equipment and disposed in a designated glassware bin.
First Aid:
If injury occurs then a qualified first aider should treat the casualty, and an ambulance called if appropriate.
ANALYSIS OF RESULTS
Overview of results
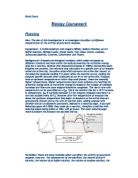
There is a clear trend that rate increases in proportion to the number of chloride ions present at a specific concentration of substrate. This is shown in the first section of the graph, and can be shown as a percentage increase per mole of chloride ions:
751.2 %.mol-1
The graph then plateaus when all the allosteric active sites are bound with the activator (Chloride ions) and the rate is proceeding at it’s maximum velocity (that is, all the catalytic active sites are bound with substrate) f ES = 1. Furthermore, the predicted initial activity (before the addition of Cl ions) was present
Explanation of results
This evidence suggests that the original hypothesis was correct. Each section of the graph can be explained using the principle of allostery. That is the enzyme has two subunits. Each can exist in two states R and T, and the R state has a greater affinity for the substrate than the T state. Therefore the possible combinations of subunits are: RR, RT, TR, and TT, however only RR and TT are allowed as the change in one subunit must be mirrored in the second subunit. Due to this it is possible to refer to the whole enzyme as in either the R- state or T-state. (Fig 1)
The first section of the graph (initial activity) can simply be explained by the fact the T-state is still able to bind with the substrate, but with less affinity than the R-sate, hence some activity occurs but at a relatively low velocity.
The second section of the graph (proportional increase) can also be explained using this theory. To take an individual enzyme molecule. When the chloride ion binds to the one of the sub units, it changes it, and therefore its ‘sister’ subunit into the R state. As such both subunits already have the highest affinity for the substrate without the presence of substrate. Consequently, as the chloride ion concentration is increased there are proportionally more enzymes in the R-state. This can be described as a shift in the “T – R conformational equilibrium towards the R-state” Stryer – Biochemistry 1995. As more enzymes are in the R-state then the f ES (fraction of catalytic active sites bound with substrate) will increase, causing the reaction velocity to increase proportionally.
Finally the plateau of the graph can be explicated using the reasoning that at a certain concentration of chloride ions all of the enzymes will already be in the R-state, and so all the active sites will be bound to the substrate. Therefore a further increase in chloride ions will have no effect on reaction velocity.
In a more generalised look and the effect of allosteric activators, their main effect is to remove the sigmoidal toe, which is observed on all allosteric enzymes as well as certain proteins such as human haemoglobin in a velocity vs. substrate graph (fig 2). When little substrate is present, it is binding with a low affinity to one of the enzyme subunits. This then changes to a high affinity as the T – R conformational equilibrium shifts towards R and so any further substrate can bind with a high affinity producing a sigmoidal plot. The allosteric activators allow the enzyme to reach a maximum rate with less substrate present. This is demonstrated by this experiment, and the graph below, at a definite substrate concentration, the f ES is increased in the presence of an allosteric activator. This effect can be used to an organisms advantage dependant upon its requirements and substrate availability
Hence further experimental work is required to investigate this effect further, by varying substrate concentration with, and without allosteric effector (activators and inhibitors) present.
An inconsistency to be noted from the summary table is that in the first repeat the reaction was appreciably faster than in the second repeat. This could have been due to a number of factors which will be discussed in the evaluation, however the trend remains the same despite a general increase in rate from one experiment to the next.
EVALUATION OF RESULTS
Though the results obtained deviated little from the line of best fit variations did occur between individual concentrations, and over entire repeats. These anomalies are due to the following limitations in the experimental method.
There are several severe limitations to this experiment, the most crucial of these is the failure to be able to accurately identify the endpoint. Using the iodine method the change in colour is often very slow, particularly in the reactions with a low concentration of chloride ions the difference in colour over a 15 second interval is almost undistinguishable. It is also possible that the perception of the endpoint colour could change over the span of several days in which the experiments took place. This could account for the apparent increase in rate from one day to the next.
Another possible source of error could be from the solutions of amylase. The powdered form used was several years old and its activity may have diminished unevenly throughout. As a result of this the solutions used may have varied, and although the up-most care was taken to accurately produce consistent solutions, variation is most probable.
In the time available a repeat of each experiment was possible which further validates the conclusions in the above analysis, however at least one more repeat would be suitable to provide proof that the trend described is correct. Overall it is possible to say that the experimental evidence is adequate to corroborate the conclusions made above.
Further work to be considered other than repeating the experiment, would be to quantify the numbers of enzymes present in solution by calculating the relative molecular mass, and consequently analysis of the numbers of active sites present per enzyme molecule. This would also allow specific calculations of the equilibrium constant ‘L’ (the ratio of R – T state enzymes) to be made.
Other allosteric proteins should also be investigated such as human haemoglobin to confirm that the hypothesis relates to all allosteric enzyme.