Preliminary work:
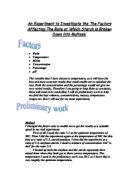
For my preliminary work, I am going to find a suitable range of starch concentrations to use for my main investigation.
From the results from my table above, I found that using a starch concentration of 5ml and diluting this down would be most suitable for my main experiment since using a greater volume of starch would take too long to be broken down by the amylase.
Prediction:
Using my background information, in particular the collision theory, I predict that as the concentration of starch increases, the length of time it will take for amylase to break down starch will also increase. This is because increasing the concentration of starch increases the number of starch particles, which means that it will take longer to collide with the amylase particles. If there are more starch particles and less amylase present, the rate of reaction will be slower as there are less active sites from the amylase, and more starch to break down.
Also the higher the concentration of starch particles the more chance of a particle having enough activation energy. The activation energy is the amount of energy needed to make the two particles react, without it the particles would not successfully react. However, although there would be more starch particles, there would still be the same amount of amylase to break it down, so it would take longer for the amylase to break down higher concentrations of starch, therefore the rate of reaction would be longer.
In my experiment I am only going to vary the concentration of the substrate. If you increase the amount of substrate molecules and not the number of enzyme molecules, the rate will not increase as there will not be enough enzyme particles to breakdown the outnumbering substrate particles.
Variables:
The table above shows that the concentration of starch will be an independent variable and all other factors will be controlled i.e., pressure, temperature and the volume of solution.
The factor I will be changing in order to make the investigation work is the concentration of the starch. I am doing this so that any change in the time taken for the starch to be broken down can be said to be due to the concentration which reinforces the aim of my investigation.
I will have two stock solutions, 2% starch and 0.2% amylase. I have chosen to reduce the concentration of starch.
These are the different concentrations of starch I will be using for my investigation: 0%, 20%, 40%, 60%, 80% and 100%. They will be diluted with water and this is how:
Measurements:
I am going to measure the time taken for the enzyme amylase to break down its substrate, starch by using a stopwatch. I will not attempt to measure the time taken for the breakdown of starch to less than the nearest second as the end point of reaction is difficult to judge precisely. I will put 10 droplets of the iodine solution onto the spotting tile and every 30 seconds I will put droplets of starch and amylase solution on it. When there is a colour change from black to brown I will stop the stopwatch and record the time. I will repeat each experiment thrice to check accuracy and reliability. If my measurements of the reaction time at any concentration don't agree, I will carry on repeating the experiment to see whether I can reject any odd results or not.
Apparatus:
1 Spotting tile
3 syringes
1 graduated pipette
Iodine solution
2% starch solution
0.2% amylase solution
Water
Thermometer (to ensure the experiment was held at room temperature)
4 beakers
Test tube rack
1 test tube
Method:
Firstly I will measure out the volumes of the stock solutions from starch and amylase, and amylase will always be 5ml so that any pattern seen can be said to be due to the starch, and not any other factor. In order to make it a fair test, all variables apart from the concentration of starch were kept the same, i.e. the amylase was kept at 5ml at all times, all experiments were carried out at room temperature and the volume of solution was kept constant too. I will do in total, 6 experiments: 5ml starch and 0ml water, 4ml starch and 1ml water, 3ml starch and 2ml water, 2ml starch and 3ml water, 1ml starch and 4ml water, 0ml starch and 5ml water. The reason for using six different concentrations of starch was to give a more accurate pattern of results. The range of concentrations used is 0% to 100%. This spread will provide enough results to show the relationship between the concentration of starch and the rate of reaction. To ensure accurate and reliable results are obtained, the experiments will be repeated three times and an average of those will be taken.
For each experiment I will record the temperature and make sure the experiments are held out at 25 C. I will use a pipette to put 10 drops of iodine solution onto a spotting tile. Once amylase is added to the starch and water in a test tube I will stir the solution with a spatula and after 30 seconds I will add the solution to the iodine and note the colour of the solution every 30 seconds hereafter. I will wash the syringe in between each experiment to make it a fair test. At first the iodine solution will be black but as the reaction takes place the iodine will change from black to brown/orange showing that the starch has been completely broken down.
Precautions and safety:
To avoid experimental error, I will need to make sure I do these things for each experiment:
- Use the right amount of solution
- People in the group should be in charge of doing the same thing each time
- Wash apparatus in between experiments
- Wash syringe in between experiments
I will repeat each experiment three times and then take the average results of the three. This is so that my results are reliable and so I gain a more accurate pattern in my results.
Obtaining:
100% starch (5ml starch and 0ml water)
Average: 210 seconds
80% starch (4ml starch and 1ml water)
Average: 180 seconds
60% starch (3ml starch and 2ml water)
Average: 150 seconds
40% starch (2ml starch and 3ml water)
Average: 120 seconds
20% starch (1ml starch and 4ml water)
Average: 80 seconds
0% starch (0ml starch and 5ml water)
Average: 0 seconds
I had three anomalous readings, which are included in my rough graphs on the following pages.
Analysis:
Using my obtained results and the graphs plotted, I conclude that as the concentration of starch is increased, the longer it takes for the amylase to break down the starch. This indicates that the rate of reaction decreases as the concentration of starch is increased.
The graph showing the time taken for amylase to break down different concentrations of starch gives a positive correlation. In this case it means that as you increase the concentration of starch, the time taken for amylase to break the starch down will also increase. These results and this graph support my prediction, relating to the collision theory. As you increase the concentration of starch in the solution, the time taken for amylase to break it down will increase as well. This is because there is a fixed amount of amylase in the solution at all times. Also, with a higher concentration of starch, there would be more chance of successful collision but this will take longer whereas if the starch had a low concentration it would have less chance of successful collision but the particles that do react would make the reaction faster.
From looking at my rough graphs you can see that there were a few anomalous results which did not fit my curved line of best fit. I had to repeat experiments and redo the graphs until I had a perfect curved line of best fit. My anomalies may have been due to the fact that the room temperature was not always constant, and all the experiments were not taken all at the same time so the temperature could have varied.
All enzymes are proteins. They are composed of long chains of amino acids twisted into complex three-dimensional shapes. They have a small region on their surface called the active site. This is where the enzyme reacts with the substrate, forming an enzyme-substrate complex. When this happens, it lowers the energy needed to start the reaction, so the enzyme-controlled reaction proceeds more easily. By increasing the substrate concentration, the amount of substrate molecules increases disproportionately to the number of enzyme molecules. Therefore there are not enough active sites for all the substrate molecules to fit in. therefore, the time taken to breakdown all the substrates increases as you increase substrate concentration. My results support this scientific knowledge and prediction.
Evaluation:
This investigation was fairly simple and safe to carry out and it did provide me with accurate and reliable results. I know that my results were reliable since the results of the repeated experiments were close to those of the original experiments. I used the average of the three results to obtain a more accurate pattern in my results. My results were fairly accurate, but they could have been more accurate with less human error. Deciding when to start the timer, the number of times I stirred the amylase and starch solution, and deciding when to stop the timer could all have led to inaccuracy of results. As you can see from my two rough graphs, I did have 3 anomalous readings in my results altogether. These results did not fit my line of best fit so I repeated the appropriate experiments until all the crosses fit the line of best fit.
The experiment was safe to conduct since I used safety goggles to protect my eyes from any harmful substances, and I wore a lab coat to avoid spoiling my clothes by spilling substances on them.
If I were to carry out the experiment again, I would use a wider range of concentrations of starch so that any pattern that emerges will become more evident.
In order to provide additional relevant evidence, I could vary the amylase concentrations as well as starch concentrations as this would remove the limiting factor. I would then have a wider range of reaction times to analyse.