Hypothesis
Hypothesis
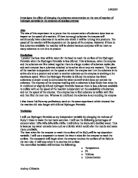
“There will a greater number of adult shrimps present in areas of faster water flow whereas a greater number of juvenile shrimps will be present in areas of slower water flow.”
Null hypothesis
"There is no relationship between flow rate and the size of shrimps.”
Statistical test
The degree of correlation between flow rate and shrimp size will be determined by calculating a Spearman’s ranks test. The statistical test will provide answer to whether there is a positive or negative correlation between two sets of data (number of juvenile and adult shrimp and flow rate) or whether no relationship exits.
Apparatus
A wide range of equipments are needed for sample collection and the monitoring of the abiotic variables of the different sites of the river.
Key variables
Controlled variables
Preliminary study
For the preliminary work a variety of techniques were used in order to collect samples of shrimps. I took 20 readings and observed the trends and patterns. The method of sampling included ‘kick’ sampling. The ranges of flow rate at the river were found to be 0.159m/s-0.624m/s. The numbers of juvenile shrimps at each part of the river were found to 0 to 60. The numbers of adult shrimps at each part of the river were found to be 0 to78. This provided me with a rough guide on the range of number of shrimps living in that part of river Mole and a rough estimate of the number of shrimps I should expect to find during my investigation. I observed if there was any significant relationship between the data values. I noticed that at faster flow rates there was greater density of adult shrimps whereas at slower flow rate there was greater number of juvenile shrimps. The apparatus used for preliminary work is shown in the method and apparatus section above. The method used for preliminary work was same as the one used for actual method. The apparatus used for the preliminary work is shown on page 5, 6 and 7 in table.
Ethical considerations
Shrimps are small freshwater invertebrates allowing me to investigate their distribution in the habitat in terms of biotic and abiotic factors. Shrimps are living things therefore it is important to respect the organisms.
The investigation will be carried out at the river to prevent the removal of shrimps from their habitat. The shrimps will be replaced into the river after I have finished counting and recording.
Method
I will sample twenty different sections of the river randomly. This will give me a suitable amount of data to adequately perform statistical tests such as Spearman’s rank coefficient.
In each random section temperature, dissolved oxygen concentration an samples of freshwater shrimps will be taken.
-
Tape measure was placed along the river bank (7 meter across) and random numbers were generated using a calculator for 29 sites.
- Freshwater was collected into the enamel tray for the shrimps.
- Random number was found on the tape and 4 steps were taken into the river in order to carry out random sampling.
- The point found by taking 4 steps using a random number is the point where a quadrate was placed vertically.
- The D-net was placed next to the quadrat upright in the direction of the water flow.
- The ‘Kick’ sampling technique was continued for 45 seconds.
- The organisms collected were placed into the enamel tray.
- The entangled organisms still stuck to the D-net were collected into the tray by pouring water through the net around. This allowed any excess organisms to be collected together with the rest of the organisms.
- The pipette and spoon were used to collect and distinguish between adult and juvenile shrimps, as this was done, the number of adult and juvenile shrimps captured were counted.
- The results were recorded in a form of a telly chart for the area indicated by a random number.
- On the same spot the flow rate was measured by first setting up the hydro prop apparatus.
- The complete hydro prop was placed into the river on the area indicated by the random number. The hydro prop was placed in the direction of the water flow with the propeller at the end that was away from the main body of the hydro prop.
- The stopwatch was started when the impellor started moving from one point to another.
- The stop watch was stopped as soon as the impellor reached the other end.
- The time taken for the impellor to migrate form one end to another was then recorded.
- The above procedure was continued for each of the 20 random areas in the river.
- The same way temperature and the dissolved oxygen concentration were measured for each section indicated by the random number.
Risk assessment
Results
Table 1: The effect of flow rate on the size of freshwater shrimps
Graphs
Graph 1: Showing the effect of flow rate on the number of juvenile shrimps
Graph 2: Showing the effect of flow rate on the number of adult shrimps
Spearman rank’s test
H0: There is no significant relationship between water flow and shrimps size.
H1: There is a significant relationship between water flow and shrimps size.
Test 1
Table 4: Statistical analysis for juvenile shrimps
Thus:
Rs = 1 – (6∑D2) = 15864 = 1.98
n3–n 7980
Rs= 1 – 1.98
= -0.98
Test 2
Table 5: Statistical analysis for adult shrimps
Thus:
Rs = 1 – (6∑D2) = 9 = 0.00112
n3–n 7980
rs= 1 - 0.00112
= 0.99
Analysis
Graph 1 shows a negative correlation, showing as the flow rate increases the number of juvenile shrimp decreases. The highest numbers of juvenile shrimps are found at the slowest flow rate. Table 1 show that 74 juvenile shrimps are found at 0.159ms-1 and graph 1 shows this trend. The lowest numbers are found at fastest flow rate. Table 1 show that only 1 juvenile shrimp is found at 0.574ms-1 and no juvenile shrimp is found at 0.624ms-1 and graph 1 show this trend.
Graph 2 shows a positive correlation, showing as the flow rate increases the number of adult shrimp increases. The highest numbers of adult shrimps are found at the fastest flow rate. Table 1 show that 70 shrimps are found at 0.624ms-1 and graph 2 shows the trend. The lowest number is found at the slowest flow rate. Table 1 show that 1 adult shrimp is found at 0.159ms-1. Same numbers of adult shrimps were found at two different flow rates. Six shrimps were found at flow rates 0.227 and 0.223ms-1.Graph 2 and table 1 show the trends.
The total number of adult shrimp is 714 and juvenile is 596. The number of adult shrimp is greater than juvenile shrimp.
Analysis of Statistical test
Test one measure the correlation between juvenile shrimps and flow rate. The critical value at 95% significance level is 0.447. The Rs value for juvenile shrimps is -0.98>0.447 . The value of Rs obtained has a negative value indicating a negative correlation. The value of -0.98 suggests a strong correlation.
Test two measures the correlation between adult shrimps and flow rate. The critical value at 95% significance level is 0.447. The Rs value for adult shrimps is 0.99>0.447. The value of Rs has a positive value indicating a positive correlation. The value of 0.99 suggests a strong correlation.
Thus I reject my null hypothesis (H0) and accept original hypothesis (H1). There is a significant relationship between flow rate and the size of shrimps and 95% significance confirms this is not due to chance.
Conclusion
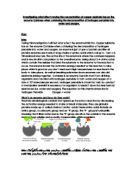
A greater number of adult shrimps are found at sections of faster water flow rate compare to juvenile shrimps because adult shrimps are well adapted to high currents. The adult shrimps can cling on to the rocks found at high currents however the juvenile shrimps are yet to develop these features. They are streamlined and have the physical strength and swimming abilities to prevent themselves from being swept away by the high current compared to juvenile shrimps. In faster sections of the stream, other fresh water organisms such as some fauna, leeches, springtail, flatworms and water boatman do not survive due to being unable to cling on to rocks and being washed away by high currents. This means there is less overlap of the niches of organisms and thus less interspecific competition for the adult shrimps. The adult shrimp population is able to grow larger in these high current areas, thus proving my hypothesis “there will a greater number of adult shrimps present in areas of faster water flow whereas a greater number of juvenile shrimps present in areas of slower water flow.”
The total number of shrimps is higher at faster flow rate. The faster section of the river has more stones, allowing shrimps to cling for shelter to avoid the current. The stones act as barrier for shrimps against the water. Thus the numbers of shrimps in these faster, rockier sections thrive. In slowest sections of the river more sediment is deposited. This leads to muddy sections of the river bed. Here shrimps will have less protection from the currents. This is far difficult then hiding behind a stone. Fewer numbers of shrimps will be able to remain there, thus thier numbers overall are lower in slower sections of the river.
The abiotic factors tested remain constant throughout the river; it is therefore assumed that the varying number of adult and juvenile shrimps collected at each part of the river is not affected by these. The constant nature of the abiotic factors is caused by the moving nature of the water. Oxygen and other substances will be well mixed to obtain equilibrium. The temperature of the water remained constant for the same reason. Table 1 supports this.
Evaluation
I am pleased with my method and table of results as they turned out to be quite informative. I believe my results were reasonably accurate as I was able to investigate into the effect of flow rate on the size of freshwater shrimps.
There was one anomaly in my results. There were same numbers of adult shrimp at two different flow rates. This again could have been reduced by repeating the measurements. This could also have resulted from limitations in method discussed below.
A wide range of factors act along with the speed of water flow to affect the size of shrimps. Assumptions were made that other factors will not vary greatly since the sampling was conducted in a single river and at the same site. Although many factors were tested to confirm they were constant, there were fluctuations in temperature and oxygen concentrations at some sections of the river. This could have affected the number of shrimps leading to limited reliability of the findings. Repeating the measurements could have reduced this error.
There were abiotic factors that I did not have the means to measure, affecting the size of shrimps. For-example the nitrate and phosphate levels, which often simulate shrimps growth, can determine the number of shrimps. Sections of the river may have higher nitrate or phosphate levels which could lead to greater number of shrimps in that part of the river. I could have also measured PH levels because variations in PH can affect the number of shrimps found at each site. Calcium carbonate concentration is another abiotic factor affecting the number of shrimps. Shrimps require calcium to form and repair their shells. Greater levels of calcium carbonate concentration at one section could mean a greater number of shrimps. The assumption was made that all of the shrimps which were collected in each sample were correctly classified and tallied. However it was not possible that every single shrimp is counted. The count and classification was difficult because of the amount of substrate brought up along with the sample. Large numbers of shrimps in a single sample and their fast movement also made counting difficult.
The method brought along disturbances that were unavoidable. The disturbance was caused to both the water and the substrate of the river bed other than that of the sampled area. This is due to many groups conducting investigations in the same river at the same time. The disturbance also meant that various abiotic factors of the river were disturbed. The speed of water flow was also affected as people standing in the river unavoidably obstruct the flow of the water.
The possible sources of error could have resulted from limitations in the method. Total substrate from the ‘kick’ sampling was not collected due to the width of the net. It is impossible to collect every bit of sample that is kicked up. It is very difficult to control the area of stream bed disturbed by each kick. The number of kicks is kept constant but it is very difficult to keep constant the area and amount of substrate sampled each time. It cannot is confirmed that every shrimps collected will be counted because of the substrate brought up with the sample. The handling of the hydro-prop and at the same time keeping an eye on the stop watch was difficult. A digital flow meter could have been used as this is accurate and eliminates any human errors. Variations in flow rate and increased number of shrimps in some samples may have been due to other investigations taking place upstream.
To further improve my investigation I could have sampled different sections of the river to further establish a trend, sample different river to see if a trend is replicated, retest the section of the river that gave an anomalous result, take into account factors such as ph, calcium carbonate and phosphate & nitrate levels and use a digital flow meter to record flow rate. I could carry out further work related to this investigation for-example I could investigate the effect of flow rate on mayfly nymph.
Reference