pH – all hydrogen peroxide used in the experiment is taken from the same batch. Also, the concentration of the hydrogen peroxide is a controlled variable which means that its pH will remain constant throughout the whole investigation.
However, the concentration of celery extract will vary for each set of experiments. Preliminary investigation revealed that celery extract has a pH of 7; neutral. This resolved the problem as for concentrations of celery extract below 100%, water was added to make up the volume, which also has a pH value of 7. Therefore, adding water to celery extract will cause no net change in pH of the final solution. However, each test solution will be checked using universal indicator paper to ensure that pH is kept constant, if not then steps will be taken to correct it.
Temperature – the test tubes containing the test solution will be placed in a water bath containing water maintained at a constant optimum temperature. As the temperature in the room in which the experiments will be taking place is likely to fluctuate during the course of the reactions. Therefore, with the use of a water bath and a thermometer, continuous observation of the thermometer can be used to ensure a constant temperature can be maintained for every single experiment.
Enzyme concentration – this is the independent variable and thus it is the factor being varied for each set of experiments. For the range and series of concentrations of celery extract that will be used see the “preliminary work” section below. Although percentage celery extract is being varied with each set of experiments, a constant volume of celery extract/enzyme is kept so that the net volume of the test solution is kept constant.
Substrate concentration – this is also a controlled variable and is kept constant throughout the experiments. The method by which I plan to achieve this is that the hydrogen peroxide will be prepared to a concentration which does not need to be specific but will have a high concentration as to provide enough substrate molecules. All the experiments will use hydrogen peroxide from this batch. The concentration of substrate is kept at a constant level by using exactly the same volume of hydrogen peroxide for each experiment.
Agitation – although this does not directly affect enzyme activity, it is an important factor when considering rate of reaction. To achieve optimum rate of reaction, there should be agitation of the two solution upon them coming into contact with each other. Means of agitation is provided by a magnetic stirrer which is responsible for stirring the two liquids. The level of agitation will be kept constant by keeping the magnetic stirrer to one setting.
Preliminary work
Two different experiments were carried out prior to this experiment for the purposes of observation of catalase catalysing hydrogen peroxide and also to formulate a suitable range and number of figures.
The first of the experiments involved adding hydrogen peroxide to tissue from different organisms. Cubes of kidney, 1cm³, in different states e.g. boiled, ground up and regular. were added to hydrogen peroxide and the results were noted. Also, plant tissue such as that from an apple, potato and celery were also added to hydrogen peroxide. The observations were tabulated and are shown below:
From this experiment, it has been shown that celery contains the most catalase out of the plant tissue. This is why celery extract has been chosen to provide the enzyme for the reaction. Kidney or other animal tissue was declined due to difficulty in handling and preparation of the substance.
Celery extract is cheap, easy to prepare, handle and readily available.
The set of experiments involving kidney was to investigate how surface area and temperature affects rate of reaction. In this case, when the kidney was ground up using a mortar and pestle, its surface area increased dramatically which resulted in the increase in rate of reaction. However, more importantly was the observation of how temperature affected enzyme activity. In this case the kidney containing the enzyme was subjected to a temperature of 100°C and resulted in all the enzymes being denatured which is why no reaction took place when the piece of kidney was placed in hydrogen peroxide.
The other experiment served the purpose of deciding on the number and range of concentrations to use for celery extract.
The apparatus used for the preliminary experiment is as follows:
6 test tubes in rack
5ml syringe without plunger and end blocked
Stopwatch
2ml syringe
Beaker of celery extract
Beaker of hydrogen peroxide
Beaker of distilled water
Delivery tube with rubber bung
Large container containing water
The procedure: 10cm³ of hydrogen peroxide was measured and poured into a test tube.
2 cm³ of celery extract was measured using a syringe
The large container was filled with water
The delivery tube was submerged into the water
The blocked syringe was filled with distilled water
It was placed over the exit part of the delivery tube
The catalase was added
Test tube was sealed using bung on other end of delivery tube
The stopwatch was started
After 2 minutes the volume of oxygen produced was noted
The results: the 2cm³ celery extract acted as 100% celery extract.
i.e. 50% celery extract would be 1 cm³ celery extract and 1ml distilled water.
The results are recorded in the table below:
Range of concentrations
Due to the small amounts of oxygen produced in each experiment it was decided that volumes of celery extract and hydrogen peroxide would be increased. This is so that more oxygen would be produced therefore generating more accurate results due to a smaller percentage error. Although volume would be increased, the range of concentrations was to remain because I believe that this is the optimum range for producing a good graph.
The volumes of each solution and dilutions of the celery extract are shown below.
Volume of celery extract : 10 cm³
Volume of hydrogen peroxide : 20 cm³
The table above shows the amount of distilled water and celery extract I will use for each concentration.
The 0% concentration of celery extract is used as a control to ensure that there is no oxygen is produced when no enzyme have been added
Hypothesis
Using my background knowledge, I predict that with increasing enzyme concentration the rate of reaction i.e. volume of O2 produced, will increase.
More specifically, I believe that there will be direct proportionality between enzyme concentration and volume of O2 produced. My reason for this suggestion is that as higher percentages of celery extract are used, more active sites from the enzymes will be available. This means that more substrates can undergo catalysed reactions at any one time. For example, if the enzyme concentration is doubled, then twice as many enzymes will be present in the same volume of solution. As a result, there will be twice as many active sites available, twice as many substrates can undergo reaction at any one time and therefore the volume of O2 produced should double i.e. the rate of reaction doubles. To represent direct proportionality between enzyme concentration and rate of reaction/ O2 produced on a graph, one would observe a straight line intersecting the origin.
My predicted graph is shown below.
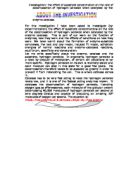
There are, however, limitations to my prediction of the straight line graph going through the origin. My theory of direct proportionality will only apply provided that there is always an excess of substrate molecules. Otherwise, not all of the active sites will be occupied because there are only enough substrate molecules to fill some of the active sites. If this is the case then rate of reaction will gradually decrease to zero after optimum rate of reaction where all of the active sites are occupied. In this instance, I believe a graph, such as the one shown below will be produced. This will be the case in this investigation, as there is a set volume of substrate which means that there will not always be an excess and after time the number of substrate molecules will diminish along with the rate of reaction.
A – roughly optimum rate of reaction where all active sites are occupied.
B – this is where there is not enough substrate molecules to attach to all enzymes.
C – the graph has flattened out completely suggesting that the reaction has stopped and all substrate molecules have turned into products.
Apparatus
Below is a list of the apparatus that I will be using for the experiments of the investigation:
conical flask
a batch of pre-made celery extract
a batch of hydrogen peroxide to a specific concentration
distilled water
magnetic stirrer
two holed bung
graduated glass burette
10cm³ syringe
20cm³ syringe
water bath containing water
Bunsen burner
thermometer
large container with water
delivery tube
universal indicator paper
stopwatch
Diagram
Below is a diagram of how the apparatus will be set up.
Method
The apparatus will be set up as shown
universal indicator paper will be used to make sure that pH of celery extract and the distilled water are the same.
Depending on the concentration the appropriate volume of celery extract and distilled water will be measured using the 10cm³ syringe.
The celery extract and distilled water will be poured into the conical flask.
Then 20cm³ of hydrogen peroxide will be measured using the 20cm³ syringe.
The hydrogen peroxide will be added through the bung to ensure a lower percentage error if any is left in the syringe and/or hole.
The stirring rod will be put in the conical flask
the flask will then be placed in the water bath, containing water set at 37°C
the magnetic stirrer will be placed underneath and turned on
the water container will be filled with water
the glass burette will be filled with water and turned upside down so that the opening is submerged underwater in the water container.
the two holed bung will be inserted in the conical flask
a delivery tube is inserted in one hole, with the other end placed under the opening of the burette
the syringe containing hydrogen peroxide will be inserted into the other hole
the plunger is pushed down and the stopwatch will be started.
any gas pushed into the burette as a result of adding the hydrogen peroxide will be accounted for.
after 3 minutes the amount of oxygen produced will be recorded by reading off the scale.
each concentration will be repeated 5 times
this method is used for all the concentrations of celery extract.
Fair Test
Below are the steps that I will take to ensure that all the experiments conducted are fair tests.
the same measuring equipment is used for each experiment. So any errors in the measuring equipment will be constant in the results and therefore increasing reliability
the solutions used i.e. celery extract, distilled water and hydrogen peroxide, for each experiment are all taken from the same batch so concentrations will be constant
Safety
This investigation involves reactions which have relatively low risks, however, one is handling with a corrosive substance, hydrogen peroxide, and also the use of Bunsen burner. Therefore, I have taken steps to minimise any potential hazards.
H2O2 coming into contact with eyes – wear goggles, standing up when doing the experiments
H2O2 coming into contact with skin – wear gloves, try to avoid spillages, standing up when doing the experiments
Bunsen burner coming into contact
With skin and other apparatus – use a heat proof mat, point flame away from oneself
Obtaining Evidence
Agreed apparatus and method
The experiments were carried out using school apparatus and in a classroom with other pupils. Therefore, for convenience and speed, a set list of apparatus and method was to be used by everyone. This was the apparatus used:
100cm³ hydrogen peroxide (20 vol)
30cm³ celery extract (100%)
100cm³ distilled water
5 x small test tubes in a rack
1 x 10cm³ syringe
5 x 2cm³ syringes
1 x 100cm³ conical flask
1 x 2 holed rubber bung & delivery tube
1 x burette with sealed end
large beaker
clamp stand etc.
stopwatch
- Using the syringe, 2cm³ of 100% celery extract in conical flask.
- The collecting apparatus was set up and the large beaker was half filled with water. The burette was filled with water using a small beaker and then it was inverted into the large beaker of water, and clamped securely.
- The rubber bung and delivery tube was fitted securely into the neck of the conical flask and the flask was supported so that the end of the delivery tube was below the burette.
- Using the 10cm³ syringe 10cm³ of hydrogen peroxide was carefully introduced through the open tube in the bung. A good seal with the syringe was ensured. As the hydrogen peroxide was added the flask was being gently stirred.
- The stopwatch was started immediately and the level of water in the burette was recorded at 0, 1, 2 and 3 minutes.
- Three dilutions of celery extract were made using the equipment and steps 1-5 were repeated for each dilution. The conical flask was rinsed out thoroughly with distilled water between dilutions.
- the concentrations that were used were: 100%, 75%, 50%, 25% and a control of distilled water 0%.
The table below shows volumes of celery extract and water to use for each concentration to ensure that the same volume of celery extract was used.
Results
The results from the experiments have been tabulated in different forms to make them easier to understand and study.
The table below shows the level of water left in the burette at the specified times, for the reaction between celery extract and H2O2.
Table No.1
Below is a table which shows the effect of enzyme concentration on the volume of O2 produced from the reaction with H2O2. The figures were calculated from the above results table.
Table No.2
Using the table above, the table below shows the effect of enzyme concentration on the rate of reaction during the first minute for a reaction with H2O2. The rate of reaction is at its highest and hence most accurate, at the moment the substrate has been added to the enzyme. Therefore, to gain the most accurate reading of rate of reaction depending on concentration of enzyme one should study the amount of gas produced in the first minute, as this is the lowest time record.
Table No.3
Class Results
This investigation was carried out by the whole class, although experiments were done individually. Everyone’s results was then pooled together to find an average in the hope that more reliable results would be produced and that one can compare their own results with that of the class, which is likely to be much more accurate and reliable, to identify anomalies.
The table on the next page shows the results of each individual in the class and also the mean of the pooled data.
Analysis
Graphs
Using the tables in the previous section, one is able to plot graphs using those results. This aids the study of any trends and hence will help analyse the evidence and draw any conclusions to the results.
For graphs, PTO.
Using table no. 2, I have plotted a graph of time and volume of gas collected including all 5 concentrations. The resulting graphs show the course of reaction for the different concentrations of catalase. This means I can study how rate of reaction changes whilst the reaction is happening. Also, one can compare the course of the reaction for different concentrations of celery extract.
The other graph I have plotted is of the most significance to this investigation. Using table no. I have plotted a graph of rate of reaction; gas produced/min for the first min, against the concentration of celery extract. This helps me to study the relationship between the two factors and whether the results match my prediction.
Graph of class results
Using the table of class results I have drawn two graphs (graph 3 and 4), these are the same as my own only I used the mean of the pooled data rather than my own results to produce the graph.
Conclusion
From studying graph number two, one can see that as the concentration of the catalase increases the rate of reaction in the first minute also increases. From just looking at the curve of best fit, it is difficult to see any immediate relationships between the two factors. However, if a line of best fit is drawn, to roughly encompass all the points, then a graph similar to the predicted one emerges. The line of best fit is straight and intersects the origin which suggests that there is direct proportionality between concentration of the enzyme and the rate of reaction with hydrogen peroxide. For example, when enzyme concentration is doubled then rate of reaction is also doubled. The actual result does not match my prediction exactly as my graph does not show a straight line graph going through the origin. This is most likely due to be caused inaccuracies and the limitations of the experiments, these will be discussed in more detail in the Evaluation.
The first graph shows the course of the reaction for all five concentrations, all the lines have the same appearance, except for 0%, in that the gradient for the first minute lowers as the concentration of the catalase becomes less. At the beginning of the reaction, when the substrate is added to the enzyme, this is when the rate of reaction is at its optimum which is why the gradient is very steep for the first minute, however, as the time goes on, the graph slowly becomes less steep and eventually levels off between the second and the third minute. If the experiments were allowed to continue for longer then the graph would eventually reach a point where it is completely horizontal as all the substrate molecules have been turned into products. The lower the concentration of enzyme, the lower the initial gradient and the graph also levels off at lower volumes of gas collected. This means that at lower concentrations the initial rate of reaction is lower and also smaller amounts of oxygen is collected.
The above does not apply to the control solution of enzyme concentration 0%, the volume of gas collected was 0cm³ for the duration of the experiment therefore its graph lies on the x-axis.
Interpretation
Graph 1 shows the typical course of an enzyme catalysed reaction, with a high initial gradient/rate of reaction, which levels out as time goes on and eventually flattening out completely. This is because the rate of reaction is at its peak when the substrate has just been added to the enzyme as at this moment, there is a maximum number of substrate molecules and a maximum number of available active sites for the two to join to make enzyme-substrate complexes. My reasoning is based on the collision theory, where the substrate molecules do not have to travel far before meeting an available active site, this means that substrate are colliding off each other frequently and that free active sites are always nearby to catalyse the reaction and make products, in this case oxygen. Usually all the enzymes have formed enzyme-substrate complexes and substrate molecules are waiting to for an available active site, this is called saturation of active sites.
This is the reason why during the first minute of the reaction the majority of the oxygen has already been produced.
As the reaction continues the number of substrate molecules available are dramatically reduced, show by the sudden decrease in the gradient of the graph, which means that there is now a much lower chance of the enzymes coming into contact with a substrate molecule, as a result much less oxygen is being produced and hence the rate of reaction becomes very low, and steadily drops. This is illustrated in graph 1 by the line slowly levelling out, eventually all the substrate molecules will have formed products and no more reaction will take place. The diagram is a copy of graph 1 and is annotated to aid understanding of the graph produced:
A – roughly optimum rate of reaction where all active sites are occupied.
B – this is where there is not enough substrate molecules to attach to all enzymes.
C – the graph has flattened out completely suggesting that the reaction has stopped and all substrate molecules have turned into products.
As the concentration of the catalase is lowered, at saturation of active sites means less oxygen is being produced, because there are now less enzymes, thus less active sites and as a result there will be less enzyme-substrate complexes at any one time. The optimum rate of reaction is now lower which is shown by a smaller gradient in the graph. As rate of reaction decreases, chances of enzymes and substrate colliding become rarer than with a high concentration as there are now less enzyme molecules to collide with thus reducing the chance of a reaction.
When interpreting graph no. 2 I will be using the line of best fit as a basis for reasoning rather than the curve of best fit as the former provides a much more accurate interpretation of the results.
With direct proportionality, as exhibited in graph 2, when one increase the enzyme concentration , the same increase will occur to the rate of reaction.
For example, if the concentration of the catalase is doubled then one should observe an identical increase in the rate of reaction. If we study the line of best fit, we find that this theory does indeed apply
i.e. at 100%; rate of reaction = 25.5 cm min-1
at 50% ; rate of reaction = 12.75 cm min-1
If we compare these figures, when the concentration of celery extract was halved, one expects the rate of reaction to also be halved, thus producing a predicted rate of reaction of 12.75 cm min-1. when we look at the graph, at 50% celery extract, the rate of reaction is exactly 12.75 cm min-1, hence confirming the prediction.
If we look at 50% against 25% this is also the case. At 25% concentration one expects a rate of reaction of 6.375 cm min-1. the graph gives a reading of 6.25 cm min-1, which is acceptably accurate given experimental errors and uncertainties.
The reason for the direct proportionality between concentration of catalase and reaction rate, again, is due to collision theory.
At 100% celery extract, there are twice as many catalase enzymes present in the same volume of solution than at 50%. Therefore, when enzymes and substrate molecules mix, there are twice as many active sites for the substrate molecules to bind to, making enzyme-substrate complexes. So now there is more chance of a substrate colliding with an enzyme, and therefore making a product, in this case oxygen.
Enzymes are all globular proteins, which are considerably larger than the substrate. Enzymes are also specific to certain substrate. This means they only work on certain substrate. The reason for this is because they are so big there is only a small part of it which works on the substrate, this is called the active site.
The above diagrams show the active site. The above diagram also shows one of two theories which explain how enzymes work, because as said before enzymes are specific.
This theory is known as the ‘lock and key’ hypothesis. It has been called this because Fischer’s hypothesis was that the enzyme (the active site to be exact) had a specific shape (like a lock does) and only the ‘key’ (the substrate) can fit into the ‘lock’.
Once the enzyme and substrate complex has been formed the enzyme does its job and it forms the products of the reaction. Once this has been done the products leave, leaving the active site free to receive more substrate.
As said previously the lock and key hypothesis is one of two theories. The other theory is known as the ‘Induced Fit’ hypothesis.
The second hypothesis came in 1959 by a person named Koshland. He suggested a modification to the lock and key theory which was first not taken very seriously, but with more hi-tech research equipment this hypothesis is now thought to be more accurate. The hypothesis was that instead of the enzyme and substrate having an exact fit, they were very slightly different and they only changed shape when the substrate and enzyme get near to each other ie. The active sites were more flexible structures than first thought. The diagram below shows this.
Comparison of results with prediction
Graph 1 shows the course of reaction for all the concentrations of celery extract, and they all have the same appearance and show the same trend. By comparing my results i.e. graph 1, with my predicted graph, the similarity between the two sources is clearly evident. Both graphs share the same trend therefore my prediction and explanation was correct and my results were also accurate enough to reflect my reasoning and hypothesis.
From just looking at the curve of best fit on graph 2, it is difficult to see any similarity with my prediction of direct proportionality involving a straight line graph going through the origin. However, if one draws a line of best fit from 0% to 100% encompassing all the points on the graph, then the resultant line looks exactly like that of my prediction. In this instance, when comparing with the prediction it is much more useful to use the line of best fit rather than the curve of best fit as the former provides a much accurate reflection of what is happening. Any errors due to experimental limitations are excluded from the results thus offering a much more coherent background for scientific explanation.
The two graphs that I have drawn uses all aspects of my results and give an easy way of determining their accuracy and reliability, from the above comparison I can conclude that my predictions and the reasoning behind them were correct and that my results are accurate enough to reflect this.
Analysis of class results
Graph 3 and 4 are similar to 1 and 2, their corresponding graphs. This means that the results of the whole class share the same trends as that of my own e.g. direct proportionality etc.
Graph 3 has the trend that during the first minute, there is a high gradient suggesting high rate of reaction, followed by decrease in gradient and gradually levelling out as the concentration of substrate molecules decrease, similar to graph 1. However, there are some differences; in the graph of class results, the decrease in rate of reaction after the 1st minute is much less dramatic than my own graph. Rate of reaction is still quite substantial and signs of the graph flattening out are not as prominent as the line observed in graph 1.
As the celery extract and hydrogen peroxide solution used by the class came from the same batch, this variation is unlikely to have been caused by the nature of the enzymes and substrate, it is much more likely to be due to differences in apparatus (see evaluation).
The reason that this trend is observed for graph 3 is the same as that of graph 1, since both are similar it is only reasonable to suggest the same thing is happening in both cases. That the rate of reaction is at its peak when the substrate has just been added to the enzyme as at this moment, there is a maximum number of substrate molecules and a maximum number of available active sites for the two to join to make enzyme-substrate complexes. My reasoning is based on the collision theory, where the substrate molecules do not have to travel far before meeting an available active site, this means that substrate are colliding off each other frequently and that free active sites are always nearby to catalyse the reaction and make products, in this case oxygen. Usually all the enzymes have formed enzyme-substrate complexes and substrate molecules are waiting to for an available active site, this is called saturation of active sites.
This is the reason why during the first minute of the reaction the majority of the oxygen has already been produced.
As the reaction continues the number of substrate molecules available are dramatically reduced, show by the sudden decrease in the gradient of the graph, which means that there is now a much lower chance of the enzymes coming into contact with a substrate molecule, as a result much less oxygen is being produced and hence the rate of reaction becomes very low, and steadily drops. This is illustrated in graph 1 and 3 by the line slowly levelling out, eventually all the substrate molecules will have formed products and no more reaction will take place.
Graph 2 and 4 are almost identical, when a curve of best fit is drawn an “s” shaped graph is observed akin to that in graph 2. Scientific knowledge suggests that a straight line graph should be produced, however, this is not the case in both graphs. Therefore, this is most likely due to limitations in the apparatus (see evaluation). When a line of best fit is drawn, it does not intersect the origin. This maybe because of an anomaly or oxygen being produced even when no enzyme was added. This is possible as hydrogen peroxide breaks down naturally in to oxygen and water, catalase simply increases the rate of reaction. Using the line of best fit, direct proportionality is observed once more, as with graph 2. The scientific explanation is the same for graph 4, At 100% celery extract, there are twice as many catalase enzymes present in the same volume of solution than at 50%. Therefore, when enzymes and substrate molecules mix, there are twice as many active sites for the substrate molecules to bind to, making enzyme-substrate complexes. So now there is more chance of a substrate colliding with an enzyme, and therefore making a product, in this case oxygen.
Evaluation
Validity
When considering the validity of my results I compared them to the average results from the whole class (see graph 3 and 4) as well as my own.
From comparing me results to my prediction and also the pooled results of the whole class, similarities are seen to arise.
Since graph 3 and 4 are averages of the whole class, they can be viewed as very reliable results.
When comparing graphs 1 and 3, same graphs from different sets of results, the pattern between the two is evident. Both have curves which have a high gradient during the first minute and thereafter the curve begins to level out, although in graph 3 the decrease in gradient of the line is much less dramatic than in the graph using my results. The second similarity is that the higher the concentration of celery extract the more gas is collected at each point for the x-axis i.e. the 100% is above the 75% curve and so on.
When studying graph 2 and 4 the resemblance between the two is even more evident as both graphs have almost exactly the same shape, that like an “s”. Also, when a line of best fit is drawn, my predictions concerning direct proportionality still applies to graph 4.
Therefore, from the evidence that I have collected, my results fit both my prediction in the planning and also reflects the results of everybody in the class, hence I believe my results are accurate and reliable. (see comparison of results with prediction in Analysis also)
Anomalies
One of the most evident anomalies is that in graph 1, when after 2 mins the gradient should either remain constant or decrease, actually increases slightly. This is probably due to the fact that, as the burette filled with oxygen, the level of water lowered and therefore it took less time for it too reach the water surface. Which means at the minute marks, at two mins, a bubble could be rising up the tube but its contribution not recorded. However, at three mins, there is now less distance for the bubbles to rise so when the volume of water left is recorded at the time, the bubble may have only reached the same distance as before, at the two min mark, but its contribution to the volume of gas noted this time.
The apparatus and method were not ideal to the experiment as certain things were changed to the planned method, for various circumstances.
The apparatus could have been improved by having the conical flask inside a thermostatically controlled water bath. This would ensure that temperature would not affect the experiment in any way. The conical flask could also have had a magnetic stirrer put inside to insure that the mixture would be properly mixed up instead of only having the hydrogen peroxide in a small area of the catalase. Also, this would mean that a constant magnitude of agitation is incurred for every experiment.
The method could have been improved by having more repetitions of experiments, this was compensated for by the pooling of class results which provided accuracy as well as reliability to the results.
Event though the idea of using a syringe to deliver the hydrogen peroxide was in theory very good, when it came to the actual experiment it was found that there were some problems with using this method. Problems that arose from this were that air was forced out of the delivery tube when the syringe was pressed (giving a false reading instantly). Also, not all of the 10cm3 of hydrogen peroxide was introduced to the catalase because some of this got trapped at the end of the syringe.
To stop this from happening a larger syringe could be used eg. a 20cm3 syringe. This way all the hydrogen peroxide would be forced out because there would be an extra 10cm3 of air to push it. However with this it would mean that there would be even more air pushed into the burette to start with.
To make it so that the burette did not have that extra air in, the 0 minute reading could be taken after all the contents of the syringe had been pushed into the conical flask. At this point the stopwatch would start and the rest would carry on as usual.
The clamp holding the burette up also caused a problem because sometimes it obstructed the view of the markings. Therefore making it hard to read the volume off. To fix this the burette could be held up with something else. For example it could be held up by a piece of string, which was then clamped.
Improvements
Below are a set of possible improvements to the investigation that could have offered a more varied and accurate set of results:
A datalogger with a oxygen sensor could have been used instead of the burette configuration. The datalogger would then process detailed graphs of the course of the reaction to see how reaction rates differ with time using much smaller time intervals than 1 minute. More accurate graphs of rate of reaction according to enzyme concentration would also be produced.
A more plentiful source of catalase could be used e.g. liver, this means more oxygen would be produced in total, therefore reducing the percentage error in measurements, and also the reaction would last for much longer thus presenting more accurate results and graphs.