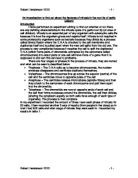
Risk assessment
In the experiment there were many risks which needed to be addressed so therefore I made a risk assessment table (shown below) in order to keep record of these risks and show how I minimised the risks. I organised the table in a hierarchical layout with what I believed to the greatest risk/danger at the top and the lowest risk at the bottom.
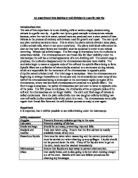
Table 1 – A table showing the raw data from 10 sets of results and an average amount found
I have also put my results into a pie chart (chart 1) and a bar chart (chart 2) to show the difference between the stages more clearly. From the results shown in table 1 and the charts we can see that the prophase stage was the most common stage in a garlic root tip, so therefore we can assume that the prophase stage takes the longest in the dividing cells of a garlic root tip, however as the chi squared test I have performed may show that this is not necessarily be true.
Chi (x2) squared test
I order to find out whether possible anomalous results are due to chance or some other contributing factor I need to use the chi squared test. The chi squared test is used to find out whether any deviation between the predicted totals and the actual totals is relevant
To do this I need many pieces of information;
- The average expected amount for each of the stages (12.5)
- The average observed amount (the average column)
-
The degrees of freedom (DF)– the amount of categories minus 1 (therefore the DF is 3)
- A null hypothesis
Null hypothesis
I believe that the amount of cells seen in each stage of mitosis will be evenly distributed between the four stages of mitosis (around 125 each), therefore meaning that each stage of mitosis takes an equal amount of time.
To work out the chi squared we need to use this formula:
x2 = (O - E)2
E
E = expected data
O = observed data
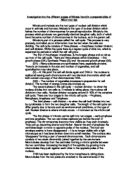
I am going to use my average results to calculate my chi squared value. To work out the shi squared I will use a table like this:
This means that my chi squared value is 11.138
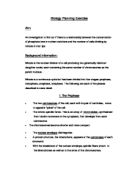
We then have to put the result into an x2 table; we have the DF so we can calculate the probability that the difference between the expected and the observed is due to chance or some other factor.Table 2 (below) is the chi squared table for DF 1 to 4.
Table 2: A chi squared chart for the first 4 degrees of freedom
(Table obtained from website; )
The degree of freedom is 3 so you need to look along the third DF column for chi squared total closest to the total obtained from previous calculations (11.138). The total closest to our total are 11.34 which is in the 0.01 column and this means there is between a 1% probability of the difference between observed and expected totals being due to chance alone.
Analysis
The probability that the difference between our observed and expected values is due to chance alone and no other factors is 1% which is much too low; therefore we must reject the null hypothesis that the stages of mitosis take an equal amount of time. The most probable factor for the difference is that the time taken for each stage of mitosis is different, with prophase taking the longest and telophase taking the least time. However we have to take into consideration that certain results may be anomalous (incorrect). There are many factors that need to be considered when interpreting results like these, such as;
- Stages taking different amounts of time to complete.
- Made up results – Not all tests done by myself (results pooled together).
- Counting a cell more than once – The cells look very similar
- Interphase not included (explained in the evaluation).
- Making mistakes about which phase is which – For example thinking a cell that is in telophase is in anaphase and vice versa.
- Poor slide preparation leading to inability to distinguish between stages of mitosis – Dye may not absorb into the cell properly.
Evaluation
I think that the experiment was not as suitable as required, I think that because the stage of the cell cycle which was left out because it is not seen as a stage of mitosis, however it is a stage which the cell spends a large amount of time in. this stage is called the interphase and through a light microscope and examined by people who are inexperienced in the ideas about mitosis may have easily been mistaken for prophase. This stage is where the D.N.A replicates itself before undergoing mitosis this stage is where the average cell spends 90% of its cell cycle, the other 10% divided between the four stages of mitosis. This could be the factor for the difference between the expected ratio of cells seen, and the actual amount observed. Therefore I believe this experiment would be better performed with a transmission electron microscope (not a scanning as this would show the surface of the cell and properly show the entire cell, because they could easily distinguish between the prophase and the interphase (although this is not possible as they are too expensive). I think my results are not reliable evidence for which to be able to be certain that the time taken for each stage of mitosis is unequal. This is due to the fact that the experiment ignored the interphase stage, I believe that my experiment would have been more successful had we been requested to identify any cells in the interphase stage and exclude them from the data, if this was done the experiment would have been much more successful. In this copy of table 1 (below I have highlighted the results that I believe to be anomalous;
The anomalous results are ones which I believe are unusually high or unusually low. These may be due to many of the factors I explained in my analysis of the results earlier in the investigation. I believe that the anomalous prophase results are due to the exclusion of the interphase stage and the anomalous results in the metaphase anaphase and telophase are due to the anomalous prophase results and in other cases due to mix ups between each of the mitosis stages. In my table the entire rows 3, 4 and 8 are highlighted this means that these people may have counted the cells incorrectly or had a lot more cells that appeared to be prophase but were actually in interphase.
Conclusion In conclusion, I believe that although my results are not accurate enough to reach a correct assumption about the differences (or similarities) between the times taken for a garlic root tip cell to complete each stage of the mitosis. This is due to the likely fact that many of the cells recorded to be in the prophase stage were in the interphase stage, which led to the large differences between the results for each mitosis stage.