Greatstone is an ideal site for the Wood sage as it has a vast neck of land and few trees to block out the sun.
The salt concentrations at Greatstone can disturb the osmosis patterns for plants. Plants which inhabit there have modified in different ways, such as having organs which secrete salt into the plant so that there is a balance of salt in and out of the plant. Another adaptation of plants involves succulents (water retaining plants) which use an increase in water content within large vacuoles to reduce salt toxicity. Wood sage has yellow-green flowers held in differing pairs on long, lean spikes. It has sage-like creased leaves. However the wood sage has little value as an herb. Wood sage will compete better in full sun or light shade.
Conclusion
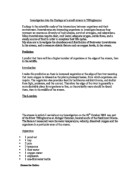
Dots and lines in the graph show that species were present in the given distance. The graph shows that False Oat Grass was very common from 19m to 100m, this could be as a result of a high amount of salt concentration due to be very near the sea which the False Oat Grass is adapted to, whereas other species may not. This would suggest that False Oat Grass has less competition in these areas and can exploit nutrients freely.
T-test
t = 200-128.8
√(1659.83/15 +1014.55/15)
= 71.2
√(110.66 +67.64)
t = 5.33
The null hypothesis shall be rejected, this suggests that the environment does affect the height of inflorescence of False Oat grass and it is not random.
Standard Minimum Method of Insect Population
The graph shows that the first sweep captured the more insects than any others. The line of best fit suggests that there is a negative correlation. As the number of sweeps increases the amount of insects captured decreases.
Wood Sage Dispersion Index
Number of Wood Sage observed in 20 randomly placed 0.25m2 quadrats.
Mean = 85 / 20 = 4.25
Standard Deviation = 6.3484
Variance = 6.34842 = 40.302
40.302 / 4.25 = 9.48 = Population Dispersion
Conclusion
The population dispersion has a value of 9.48 which allows me to conclude that the wood sage is clumped together because population dispersion value is greater than 1.
COPT POINT
Algae has adapted along the sea shore mainly due to conditions of the tide and the terrain of the specific beach, for e.g. rock coverage. Algae on the shore consist of many seaweeds or wrack.
At Copt point the lower shore consisted of roughly 20 metres of rock and shingle. The lower shore has stable conditions and is exposed only at low tides. Less light penetrates the water here. The lower shore should consist of toothed wrack (brown alga) red alga and dog whelks. These occur in the lower shore due to being able to tolerate the lower light and with stand waves. Middle shore should contain bladder wrack, limpets and periwinkles. The middle shore is submerged for half a day and requires the species it contains to be able withstand low light levels, species often wont be able to withstand desiccation.
The upper shore is submerged for short periods and desiccation occurs more often, the variation in temperature and salt levels can vary. Species found are channel wrack, spiral wrack and rough periwinkles. The splash zone is rarely submerged and often has extreme variations in temperature and desiccation. Commonly found species are lichens and black periwinkle because they have tolerance to varying salt and temperature levels
DOG WHELKS AND BARNACLES
Chi-Squared field data Copt Point 01.07.10.
Introduction: We studied the middle shore of a beach at low tide, it was densely populated with rock. We studied the rock for dog whelks and barnacles to see if there was a relationship between the two species. We stated a null hypothesis: There is no significant difference between the number of dog whelk and barnacles.
Random sampling is carried out by: a randomly selected direction and distance, the quadrat is then placed randomly against the randomly selected section.
Data collected.
Degrees of freedom = (2-1) x (2-1) = 1
Conclusion: The null hypothesis can be rejected as the chi squared value is much larger than the table result. Therefore the relationship between dog whelk and barnacles is not down to chance. The relationship is significant because 95% of the time we believe this is not down to chance
Table of Chi-squared values.
Is there a correlation between abiotic and biotic factors?
Null Hypothesis – There is no correlation between temperature and species at a certain metre on the sea shore.
17 pairs of data were taken this is multiplied by 475.5 (sum of all d2). This is then divided by 173 – 17 to give 1.65
(17 X 475.5) / 173 – 17 = 1.65
There is a significant correlation between temperature and the number of species according to our calculations
In conclusion the temperature correlated in a significant way with the number of species at the given metres. This makes sense as there are more species along the shore that are suited to warmer conditions (often outside of the water)