Hypothesis
The leaves of ivy (Hedera helix) exposed to a lower intensity of light will be have a greater length than the leaves of ivy exposed to a higher intensity of light.
Variables
Independent variable
- The intensity of light each ivy plant is exposed to
Dependent variable
- The length of the ivy leaves
Variables to be kept constant
- The time of day
- Temperature of the habitat
- The point on the ivy plant where the leaves are located
-
The amount of CO2 and O2 available
- The type of ivy measured
As this is an ecological experiment, it is not possible to control key variables. However, even if there is variation in the environment, the two plants are near each other so both of them would undergo the same variation.
Procedures
The time of day will vary but will not be a limiting factor in this experiment as both plants are in close vicinity and so
In order to measure the light intensities of each area, a light meter will be used and the readings recorded.
Temperature will vary throughout the day and cannot be controlled. However, the plants to be investigated are growing at a distance of less than 15 meters and have therefore been exposed to the same daily and seasonal variation of temperature.
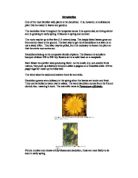
When measuring the leaves, only the frond length (without the petiole) of each ivy leaf will be measured. In order to enable a fair comparison to be carried out between the lengths of the two groups of ivy leaves, every fully formed fifth leaf from each branch will be picked and only juvenile ivy leaves will be used in the investigation. A sizeable sample of 30 leaves from each tree will be taken to obtain reliable results. The leaves will be measured along the midrib with a ruler and the measurements recorded in a table of results. Each leaf will be measured twice to minimise the chance of inaccurate measurements.
The concentrations of CO2 and O2 will affect the rate of photosynthesis in the ivy plants but as both are located close to each other; it is likely that the concentration of gases will be the same.
The ivy leaves picked will be of the same specie and of the same variety to ensure a fair comparison between the two groups of leaves.
Apparatus
- Gloves for protection
- Light meter to measure light intensity
- 30 ivy leaves from each tree
- Bags to collect leaves in
- Ruler to measure leaves
- Calculator
- Pencil/paper for results
Method
The investigation was carried out on a cloudy summer’s day at 11:00 am at a selected site on school grounds where two Hornbeam trees were available in close vicinity, with a fair distribution of light and shade in the area. Before starting the investigation, a light meter was used to measure the light intensity around both trees which was then recorded. An amendment that became necessary was measuring the light intensity four times on each site due to there being high variability between the readings in the area of investigation. This was expected however, as there are many factors which affect the intensity of light over a period of time. These include the movement of the leaves on the tree under investigation, which could let more or less light through thereby affecting the light intensity in the area. The changes in cloudiness throughout the day are another factor affecting light intensity and would result in varying light levels being exposed to the area under investigation. The intensity of light of the shaded area was 2500 arbitrary units and the brighter area had a light intensity of 5000 arbitrary units. Once it was ensured that there was a significant difference between the two light intensities, the investigation was begun. Thirty juvenile ivy leaves from each tree were carefully picked in a pattern of every fifth leaf of a branch, and put into a two bags to ensure they did not get mixed up or damaged in any way.
Inside the laboratory, the length of each leaf, along the midrib vein from the petiole end to the pointed end of the leaf, was measured with a centimeter ruler and the measurements were recorded in two separate tables [displayed later]. Each leaf was measured twice to minimise the chance of inaccurate measurements occurring. From the results, the general trend seemed to be that the ivy leaves from the brighter area were smaller than those in the shaded area.
However, a statistical test was used to analyse the results. This number of samples requires a student’s-t test to be carried out in order to compare the two sets of data.
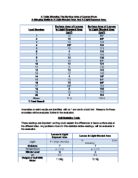
The tables below display the measurements in terms of cumulative mean for both sets of leaves.
Table 1: Measurements of Hedera helix in the brighter area
Table 2: Measurements of Hedera helix in the shaded area
The results displayed in the tables above have also been recorded in a tally chart as shown below:
The results in the tally have been displayed in the graph below to compare the two sets of data:
Results
The results table and graph clearly display evidence to support my hypothesis. The tally chart shows that the lengths of the Hedera helix in the shade were greater than Hedera helix in the sun. From the graph it can be seen that there appear to be notable differences in the lengths of the two sets of leaves, in particular between the ranges of 5.0-5.9 cm and 9.0-9.9 cm, where the majority of the sun and shade leaf lengths lie respectively. It can also be seen from the graph that there are no shade leaves measuring between the lengths of 1.0-6.9 cm whereas 26 sun leaves measure between those lengths. On the other extreme of the graph it can be seen that no sun leaves measured between the lengths of 8.0-12.9cm whereas a total of 28 shade leaves fell into these measurements. The modal lengths for the Hedera helix in the sun were between the ranges of 5.0 – 5.9 cm whereas the modal lengths for Hedera helix in the shade were between the ranges of 9.0 – 9.9 cm. This suggests that the two sets of leaves have considerably different mean lengths and their measurements are distributed widely enough to suggest significant differences between the lengths of sun leaves and shade leaves. This therefore appears to support my hypothesis.
However, the results do show some inconsistencies. The number of leaves in the class 12.0-12.9 cm is one more than was originally expected so the data cannot produce a perfect bell shaped curve. This appears to be the only anomaly present in the results as the remaining leaves were distributed more or less equally throughout the size classes.
The cumulative mean is a way of checking that the number of samples examined is adequate and that the results are reliable. Although the cumulative mean may appear quite irregular at first, it gradually settles down as more measurements are added and becomes fairly constant. This indicates that the sample size used was sufficient to produce accurate data.
In order to decide if the results are really significant, a student’s t statistical analysis will be carried out. The data shows a normal distribution, as can be seen from the graph and the number of observations is sufficient for this statistical test. The t test can be used to measure the overlap between two sets of data, in this case, the lengths of the two sets of leaves. The larger the value, the more certain it is that there is a difference between the two sets of data. This test will prove whether the results of the investigation are significant, in this case, that the ivy leaves in the shade will be longer than the ivy leaves in the sun. If the final value is larger than the critical value, the results will be significant. In that case, the null hypothesis (that there is no difference between the lengths of the ivy leaves in both the sun and shade and any difference is due to chance) can be rejected and the alternative hypothesis accepted.
Student’s t-test for lengths of Hedera helix in the sun and shade:
Mean values of Hedera helix in sun and shade:
Sun: ∑Xa = 175.5 ∑Xa² = 1047.51
Shade: ∑Xb = 285.8 ∑Xb² = 2760.06
Means of Xa and Xb:
Xa = 175.5
= 5.85
Xb = 285.8 = 9.53(2 d.p.)
Standard deviation(s) must be calculated to determine the variation from the mean in the two sets of data:
Standard deviation: ∑x² - (∑x²)
Hedera helix in sun:
1) 2)
Sa = 1047.51 – (175.5²) Sa = 1047.51 – 1026.68 (2d.p)
29
30 - 1
3) 4)
Sa = 20.83 Sa =
5) Sa = 0.85 (2 d.p.)
Hedera helix in shade:
1) 2)
Sb = 2760.06 – (285.8²) Sb = 2760.06 – 2722.72 (2 d.p)
29
30 - 1
3) 4)
Sb = 37.34 Sb =
5) Sb = 1.13 (2 d.p.)
Means and variances for Hedera helix in the sun and shade:
1) 2)
t = t = 5.85 – 9.53
na nb
3)
t = 4) t =
0.066 0.26 (2 d.p)
5) t = 14.15 (2 d.p)
Now the degrees of freedom can be calculated using the following formula:
d.f. = na + nb - 2
= 30 + 30 - 2 = 58
The nearest degree of freedom at 0.05% significance level is 60. The critical value for this is 2.00. Clearly the t value of 14.15 is much greater than this and therefore the null hypothesis can be rejected. The t test thus proves that there is a significant difference between the lengths of Hedera helix in the shade and Hedera helix in the sun and that the results are not due to chance. This therefore supports my hypothesis and the high level of significance means that my hypothesis can now be accepted.
Discussion
As can been seen from the t test, there is a large difference between the lengths of the two groups of leaves at p = 0.05%. This difference is likely to be due to the structural differences between Hedera helix in the sun and Hedera helix in the shade. Sun leaves typically have two or more layers of palisade cells that are longer than those in shade leaves and they have a thicker cuticle hence their thicker structure. Shade leaves however, are thinner than sun leaves as they have a thinner cuticle and a single layer of palisade tissue. Their ability to grow more than sun leaves is mainly due to the arrangement of the chloroplasts which are positioned in such a way as to absorb maximum light without shading other chloroplasts below them. This allows them to take advantage of any light that is exposed to them and make use of it in the most efficient way. This is made further efficient by the larger area of shade leaves in comparison to sun leaves allowing them to absorb more light over a larger surface area during photosynthesis. Shade leaves also weigh more than sun leaves as their chloroplasts contain more grana and therefore more chlorophyll, enabling them to use the light energy from photosynthesis in the most efficient manner. It was observed that the shade leaves tended to be a darker green that sun leaves; this could be due to the increased levels of chlorophyll in shade leaves. The lower levels of light cause shade leaves to produce long internodes helping them to come into contact with any light that reaches the plant and make use of it thus enabling the plant to survive in areas of low light intensity. For this reason, shade leaves are more efficient in harvesting sunlight at low light levels. This is not the case with sun leaves as there is no shortage of light so their chloroplasts are exposed to the light at different times in order to avoid overexposure which would destroy them. As they are exposed to sufficient light, the internodes of sun leaves do not grow rapidly as in the shade leaves resulting in less exposure to the wind and light. The chloroplasts of sun leaves contain less chlorophyll so their ability to use the light energy from photosynthesis for growth is not as great as in the shade leaves and they have a smaller surface area, decreasing the area exposed to the sun, so are unable to trap as much light as shade leaves hence their smaller size.
Leaves of other plants also appear to follow a similar trend. For example, leaves of brambles (Rubus fructicosus) also show the same variation in length as Hedera helix, i.e. leaves of bramble plants exposed to higher intensities of light tend to be shorter in length that those exposed to lower intensities of light.
It can be seen from the graph that the measurements of the two groups show considerable variation with very little overlap. There is only overlap in the size class of 7.0-7.9 cm. The shade leaves cover a wider range of measurements thus showing more variability than the sun leaves. This is also apparent in the size differences in some of the sun leaves and shade leaves with some shade leaves measuring double the length of some sun leaves, e.g. 3 sun leaves fell into the size class of 4.0-4.9 cm whereas 5 shade leaves measured between 8.0-8.9cm. Therefore the difference in size between the two groups of leaves is indeed very significant as shown by the t test.
A limitation of this study is that it only measured the length of leaves and not the area which may have produced different results. However, this is not likely to be the case as length is proportional to area so it is likely that the results would be very similar to those obtained in this study. Furthermore, working out the area is time consuming as opposed to working out the length which is a faster method as only a ruler is needed. Instead, time was allocated to studying a larger sample of leaves in order to have a normal distribution of data for which the t test could then be used.
For further research into this topic, the area of leaves could be compared instead of length to produce results which may confirm those obtained by the investigation into length of leaves or may generate results suggesting otherwise.
Leaves could also be compared for their thickness. This may be a difficult method as there is no simple technique to measure thickness of leaves as there is with length. However, the thickness of a leaf should be proportionate to its weight and area so the leaf could be measured for its area and weight after which the thickness could be estimated. Once again, this may confirm the findings of the investigation into length of leaves or may produce results suggesting otherwise.
Bibliography
- http://www-saps.plantsci.cam.ac.uk
- http://horticulture.coafes.umn.edu/
- http://www.the-tree.org.uk
- Tools, techniques and assessment in Biology- course guide for students and teachers – John Adds, Erica Larkcom, Ruth Miller