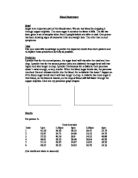
(the results are taken in seconds)
For person B:
Tests 1pm 1.30pm 2pm 2.30pm 3pm
1 59.88 35.55 29.44 27.97 33.00
2 61.53 46.14 30.22 23.56 25.22
3 68.37 30.37 35.00 25.44 26.13
4 47.28 31.54 23.69 25.84 29.93
5 54.84 47.46 27.63 33.59 26.00
6 56.07 29.19 33.62 31.88 26.65
Here are the averages (to 2dp):
Time Intervals
Person 1pm 1.30pm 2pm 2.30pm 3pm
A 50.14 30.46 30.22 32.61 38.15
B 58.00 35.55 29.58 27.58 28.02
Here are the rates of reaction; 50/time (to 2dp):
Time Intervals
Person 1pm 1.30pm 2pm 2.30pm 3pm
A 1.00 1.64 1.65 1.53 1.31
B 0.86 1.41 1.69 1.81 1.78
(units for rate of reaction are cm/second)
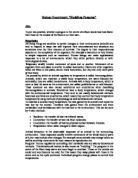
Analysis
For person A I got the graph I expected, the graph goes up and then curves downwards again. This is because the person can produce the right amount of Insulin, which helps to control the amount of glucose dissolved in the blood. Insulin prevents the blood sugar level from rising too high. The control of blood sugar level is homeostatic mechanism. For person B the graph starts slightly lower and rises higher. Also it doesn’t fall a lot straight away, it is only a slight fall. This is what I predicted because in a diabetic the pancreas doesn’t produce enough insulin, which means that a diabetics blood sugar can rise to a dangerous level and can kill them. However, this can be controlled in two ways:
1) Carbohydrate foods turn to glucose when digested so avoid eating them. Also, taking exercise after eating carbohydrates uses up the extra glucose by doing physical activity.
2) Injecting insulin into the blood before meals will make the liver remove the glucose from the blood as it enters the gut. This happens when the carbohydrate food is being digested, it stops the glucose in the blood from getting too high.
In a normal person if the blood glucose level is too high, insulin is added. Insulin is injected by the pancreas into the blood stream which contains too much glucose. insulin is absorbed by the liver and it makes the liver turn glucose into glycogen. This means the glucose is removed by the liver so the blood glucose is reduced.
If the blood glucose level is too low then glucagons is added. Glucagon is injected by the pancreas into the blood stream which contains too little glucose. Glucagon is absorbed into the liver where it makes the liver turn glycogen into glucose. The glucose goes back into the blood stream and the blood glucose is increased.
The graphs show this by their shape. I would have expected the graph for the diabetic (B) to have stayed high and not dropped at all because it takes a long time for the blood sugar levels drop. However, it only dropped slightly so I think that it is still the shape I predicted. The graph shapes are nearly the same as those I drew in my prediction, which proves that my prediction is right, the graphs shapes and my results re as I expected them to be.
The Explanation:
-
Insulin is secreted by the Islets of Langerhans which are special groups of cells in the pancreas. The Islets (little islands) are .
- If you have a large carbohydrate meal, the level of glucose in the blood will start to rise as your digestive system turns all the starch and sugars in your food into glucose.
- If you have not had a meal for several hours your blood sugar level will fall because your cells use up the glucose in aerobic respiration.
- When your blood sugar level rises, the Islets of Langerhans secrete MORE insulin.
- When your blood sugar level falls, the Islets of Langerhans secrete LESS insulin.
-
The main for insulin is the liver. It is the liver which removes glucose from the blood by turning it into glycogen.
- All other tissues in your body need insulin to help then respire glucose, so in a way they are also target organs.
- If you eat, and eat, and eat, and eat, never mind how little exercise; there will come a time when there is no more room for glycogen in your liver. High levels of insulin will make you start to turn the excess glucose into FAT.
- When you fast for more than two days, your liver will run out of glycogen, so you will have to use fat and protein to get energy.
- When your blood sugar level falls too low, not only does the pancreas make less insulin, but another endocrine gland, the adrenal gland, starts to make adrenalin and glucocorticoids.
- Adrenalin and glucocorticoids are hormones which have the opposite effect to insulin, i.e. they help to raise blood sugar level.
-
The detects the conditions in your blood. It measures many things including blood sugar level. The hypothalamus is connected to the which is yet another endocrine gland.
is the special mechanism for turning the hormones off after they have done their job. So when your blood sugar level drops, the amount of insulin produced also falls, and when your blood sugar level has risen back to normal, the amount of adrenalin and glucocorticoids falls.
(This is from the site )
Insulin and Glucagon Control Blood Sugar Levels
1) Eating carbohydrate foods puts a lot of glucose into the blood from the gut
2) Normal metabolism of cells removes glucose from the blood
3) Vigorous exercise removes much more glucose from the blood
4) Obviously, to keep the level of blood glucose controlled there has to be a way to add or remove glucose from the blood. This is achieved by two hormones “insulin” and “glucagons” which are released by the pancreas.
(NEAB Life processes Revision Guide by Richard Parsons)
Glucoregulation
Keeping a constant blood sugar level is called glucoregulation
Insulin is a hormone that reduces the level of glucose in the blood.
When you have eaten carbohydrates (potatoes, bread, rice or pasta) your digestive system releases large quantities of glucose from the food. This glucose is absorbed into the blood. High levels of glucose in the blood will cause problems so the sugar level must be returned to normal as soon as possible.
When the blood sugar level rises, the islets of Langerhans in the pancreas release insulin into the blood. Insulin makes the liver turn glucose into glycogen, which is stored. This brings the blood sugar level down. When blood sugar levels are low, the pancreas stops producing insulin, releasing glucose into the blood.
This is an example of negative feedback.
Insulin is necessary for the proper respiration of glucose. Some people cannot make insulin, so they have to inject it. If they don't they may go into a coma. People with diabetes have to be very careful with their carbohydrate intake (how much they eat).
(This information is from the internet on a site called GCSE biology revision)
Here is a diagram for NEAB Life processes Revision Guide by Richard Parsons of the blood glucose levels in a normal person:
Evaluation
I think my experiment went well because I got the results I expected from my prediction and my graphs almost mirrored those in my prediction. When doing the experiment I realised that as you got further into the experiment that the tube became clogged up with the solution of the blood so the results which were taken last could be slightly slower than usual because they would be slowed down by the other pieces of solution already in the tube. To try to avoid this I replaced the tube with a clean one when it looked like there was too much solution in there. To make my experiment completely fair I would have to use a clean tube for each reading but this was impractical as there weren’t enough tubes and it would be a very lengthy process to keep cleaning out and replacing the tubes. Also it was really hard to get it so the drops of solution were all the same size so this might have had an effect on how fast the solution fell. I tried to make sure that all the solution drops were roughly the same size but if I was to do this experiment again I would try to be more careful and accurate. In my results for the person B at 1.30pm I have a range of readings from 29.19 seconds to 47.46 seconds. These readings are too far apart but all the readings for that time seem to be dotted throughout these two extremes. I think something went wrong with these readings so next time I would do these all again to try to get more accurate results. I think our experiment went well and I got the results I was expecting.