I noticed a small gap between the inner black tube and the outer tube, which is inevitable because they have to be able to move inside one another, but it could introduce a light interference anomaly. To prevent this the tube could be used in a dark room, however, I would need a small separate lamp to read the multimeter, however even this interference would be less than that of daylight in the classroom. I will use a LED to do this because it is the smallest, lowest level of light that I have access to. Another type of light interference is the infrared light emitted by the lamp as heat. This would affect the results, as it would give the photodiode more energy, thus increasing resistance. However, this would occur whatever the light source, and as it is part of light, and light is what is being measured, it cannot be seen as a source for errors. Also, the black tube would absorb most of this infra red, this could be why I have received a lower range in my results using the black tube, than received from using just the dark room. This happens because in infra-red radiation, the photons have energies of about the same size as the energies needed to excite atoms in matter. When an infra-red photon strikes matter it is absorbed. The energy of an absorbed photon is transferred into random energy in an atom of the matter- the internal energy of the matter goes up. It gets hotter. Overall the light is lost as it is emitted and absorbed by this ‘black body’ in the form of radiation-all forms of radiation.
My results are as follows;
USING THE BLACK TUBE.
Distance from bulb (mm) Resistance of photodiode (KΩ ) Resistance of LDR (K Ω )
10 0.234 0.105
20 0.349 0.140
30 0.419 0.162
- 0.426 0.177
50 0.452 0.200
60 0.471 0.214
USING THE DARK ROOOM.
Distance from bulb (mm) Resistance of photodiode (KΩ ) Resistance of LDR (KΩ )
- 0.216 0.091
20 0.389 0.111
30 0.577 0.126
40 0.717 0.153
50 0.890 0.178
60 1.023 0.194
The experiment was to enable me to decide between the use of the black tube or the dark room, and to use either a photodiode or an LDR. I found that the photodiode was a lot more sensitive and quick compared to the LDR. The LDR had a slow response time of about 10ms, (because they take longer to be affected by atomic vibrations of the light), however the photodiode had a response time of about 1 microsecond (μs). As each component receives more light, the number of atomic vibrations increases, as the atoms of the component are receiving more energy. These atomic vibrations obstruct the flow of electrons, meaning the resistance increases. So an LDR would not detect rapid light changes as much as the photodiode because it takes longer to be affected by these vibrations. Therefore the higher sensitivity of a photodiode is much more equipped to the frequent changes the sensory component will receive in my experiment and the changes will be relatively small. However if I was to use an LDR I could wait a certain amount of time to allow it to adjust to the next reading.
But, an LDR can be more useful in some ways because it is not affected by people’s shadows. However this will not be a large factor in my experiment as I have decided on my early idea of using the black telescopic tube in the dark room to get the best results, and to read the multimeter I will use the smallest, least bright LED that I can find attached to a resister, therefore can be connected to the high voltage power pack setting.
An LDR is also very cheap so is made of poor quality material, where as photodiode are more expensive, but this could be as they are not made in the mass amounts such as LDR’s.
I will be sure to keep all of my equipment the same, throughout; because each type of component varies slightly E.g. In it’s internal resistance, and general wear and tear depending on the amount of usage within the school. Also if a higher wattage lamp were used, more energy would be provided to the photodiode, so increasing the atomic vibrations and therefore the resistance. Meaning that if the sensor were placed in the same position, it would give a different reading when used with a lamp of higher wattage, than if used with a lamp of lower wattage. Similarly, the voltage will remain constant else the energy output could be changed.
Having chosen the photodiode to be used in the back telescopic tube, further resistance readings will be taken of my full distance (10mm to 120mm) to be used in my experiment. To be able to make a potential divider circuit I firstly need to find the resistance range of the photodiode.
Distance from bulb (mm) Average Resistance (KΩ)
10 0.2027
20 0.3150
30 0.4770
40 0.5637
50 0.5703
60 0.7037
70 0.8923
80 0.9560
90 0.9910
100 1.0120
110 1.2160
120 1.6877
(Using a photodiode concealed, along with a lamp, inside a telescopic black tube-in the dark room).
These readings will enable a prediction of the voltage of the multimeter reading in the potential divider circuit. The reason of forming a potential divider circuit, being that the photodiode to be used can handle no more than 5V, so the potential difference will be used to power this component. A 3.6W lamp at 12V gave enough light to retrieve a good set of basis results (As shown above). The voltage can be detected using a potential divider. The output can be arranged to increase, or to decrease, when the sensor is illuminated, depending on which device the divider is across. I will put the multimeter across the resister so that the output p.d increases when the resistance of the photodiode decreases, as the photodiode gets closer to the lamp.
PLAN
To sense the changes in light intensity, the photodiode will be placed in a basic potential divider circuit with the voltage being measured across a 1.0KΩ (or 1000Ω) substitution box, I found this value of resister from using the median of my resistance results, then got the closest value resister (the range of my results is between 202.7 and 1168.77Ω). Therefore all of the current will not be over one device more than the other. A multimeter with high internal resistance will be used in parallel to the resister, so as not to interfere with the circuit too much.
EXPERIMENT (1). The Potential Divider Circuit.
The voltage over the resister will be measured. As the resistance of the photodiode increases, the resistor will receive less voltage, which can be recorded as a decrease in potential difference across it. The potential difference provides the energy to move charge through the device. In this way, the resistance of the photodiode can accurately display how much the light intensity is changing. This hypothesis can be furthered with a prediction of the potential difference that will be read from the multimeter for each distance. It is possible to do this with the results of the resistance measured previously, using the formula;
1000 Ω
P.d = 4.9x 1000+Resistance (Ω)
The actual voltage read from the multimeter when placed across the 5V (actually 4.9 when tested) power pack is used,
If the results are accurate the potential differences should read;
Distance from lamp (mm) Predicted potential difference (V)
10 4.074
20 3.720
30 3.318
40 3.134
50 3.120
60 2.876
70 2.589
80 2.505
90 2.461
100 2.435
110 2.211
- 1.823
Predicted range=between 4.074 and 1.823 Volts.
EXPERIMENT (2)
A Wheatstone bridge.
A Wheatstone bridge circuit will also be used, which should again increase the sensitivity, and will be incorporated into the potential divider. It is clever because it causes the circuit to only be sensitive to the changes in the ratio of the values of pairs of resisters. So forming a circuit in which the resisters are compared, gives very precise results, as well as giving no unwanted out put if there is an outside change.
The three resisters will be changed, to calibrate this sensor so that when subjected to total light the sensor reads 0V.
A prediction can be made using the potential difference results.
EXPERIMENT (3) The op amp circuit.
To see if a more accurate range of results can be achieved, two other sensor circuits will be used. The first of which is to incorporate an op amp to amplify the output. Amplifiers work with fixed signals (DC). They are called ‘operational amplifiers’ and are a useful instrumentation tool. They amplify the difference in potential between two inputs, they also ignore outside changes that do not affect both inputs equally. Their main advantage is that they need to draw very little current from a circuit, and thus do not alter the p.d they are measuring.
The op amp will amplify the potential difference over the resister in the potential divider circuit. This should gain a wider range and of more figures per result that will help form a more accurate and reliable average.
As suggested, for each sensor, the lamp will be placed at different distances from the sensor. Intervals of 10mm will be used up to 120mm. The voltage reading for each distance will be recorded. Each distance will be repeated 3 times so that an average can be calculated, so removing any fluctuations. These small unsystematic errors are present in all experimental data. Taking a average over 3 tests will improve the final results and conclusions. The sensitivity of each sensor, and usefulness of each, can then be evaluated by recording the results in tables and plotting graphs.
I will later work out the light intensity variation as an analysis using the following formula. It will be done when all of my averages have been calculated for my finished 3 experiments. I will then plot a graph of light intensity against the voltage that is measured across the photodiode during different light intensities.
Light Intensity ∞ 1 (When ‘r’ represents the distance of the lamp from the photodiode).
r²
The standard graph that I will expect to see is shown below, in which resistance is plotted against light intensity because the light intensity should decrease as distance from the bulb increases.
Voltage.
Dark
. Light
light intensity
RESULTS;
These results are very unlike those predicted, therefore from these results I will work backwards to find what the actual resistance was during this potential divider circuit. (See workings)
(when, =Constant resister.
=Resistance of photodiode.
=Voltage out.
=Voltage in).
At 10mm At 120mm
From these working it was found that the actual resistance of the photodiode in the potential divider circuit is between … and ….
From these new resistance results I can calculate what I predict the range of readings within the Wheatstone bridge circuit to be…
At 10mm At 120mm
The Wheatstone bridge readings should be between …………..and………………
The data in the table directly above shows the averages of the three experiments undertaken. Rather than being compared to the distance of the photodiode from the bulb, the voltages are compared with the changing factor of light intensity, which is worked out from the formula given previously (see below). However I firstly converted my distance recording to centimetres, from millimetres to eliminate all of the decimal places. The graph shows a related pattern to the standard one predicted in my plan.
Light Intensity ∞ 1 (When ‘r’ represents the distance of the lamp from the photodiode).
r²
ANALYSIS.
From using the graph and results tables it is apparent that the circuit containing the op amp was overall the best circuit. This is because it shows the trend to the best degree with a regular pattern that displays fewer anomalies than the other results giving the graph the most linear line of best fit. It has the best range of results and the figures are the largest out of all of the experiments, therefore their degree of accuracy is easier to be measured with the instruments contained within the school. The three tests are more similar than the others; this shows that the average is the most accurate out of all taken.
The potential divider circuit is the least sensitive because as it contains more anomalies however the increase read off the Wheatstone bridge circuit has a very gentle and insignificant decrease as the photodiode is moved from the photodiode. Therefore, it is difficult to say whether the potential divider circuit or the Wheatstone bridge is the more sensitive at first glance. However on studying the average results, it is clear that the Wheatstone bridge circuit results are more consistent creating a line that is more linear in decrease. However although the equipment remained the same throughout most of the coursework, for my Op amp circuit a different multimeter was used because the original one used went missing out of my container so I had to find another, which may have been significantly different in internal resistance, changing my result.
All of my graphs gave a clear general trend, that as the distance increases from sensor to lamp, the voltage reading decreases, or increases in the case of the Wheatstone bridge due to the nature of it’s circuitary. The readings were easy to use and compare to light intensity. However, the potential divider contained quite small results and so could prove difficult to evaluate. The Op Amp circuit shows it’s usefulness in this area, as it gave a larger voltage which was more accurate making them easy to evaluate.
The trend is not directly proportional, shown by there being a curve and not a straight line. This is because, as the lamp is further from the sensor, more light is lost to the surroundings, as the sensor only senses at a small angle of light, however the light dispersed is not great as it is within the black tube therefore is channelled-hence the changes in results only being slight.
The light intensity graphs display generally the same pattern as with distance as they are directly proportional to one another. However the average of the Wheatstone bridge should not be displayed on the same graph as it’s effects are opposite to the other two experiments, this is why originally the axis was reversed in the distance graph. However if this was done, but on another graph the pattern would show the correct form, but is not needed.
I did not keep checking the voltage reading at 5 volts; I only checked it during my preliminary experiments. It was 4.9V. It was important to check the voltage because there is a lot of internal resistance in the circuits which decreases the voltage, such as internal resistance found in the power pack and the wires that carry the power. This could be why there are anomalies within my experiments because the voltage could have varied significantly. Also as more substitution boxes were added to the circuit in forming new sensors, the resistance would have increased further as they induce more resistance within the circuit therefore causing more of a (in) voltage decrease.
I also found during my experiments that at 10mm there would be large decreases in voltage out until around 40mm to 70mm then the range would increase again. I can not fully explain this further than the fact that because it was within a black tube, there was very little dispersion of the light as it was channelled. And at the bulb end of the tube light was dispersed as infra red radiation and at the other end at around 110mm the light was lost out of the gap where the tubes were less joined.
CONCLUSION.
In the potential divider, when detecting a faint light source, the feeble light only changes it’s resistance a little, so the output voltage only changed by a few millivolts at a time. The solution was to amplify it using the electronic amplifier to increase the signal or place it in a Wheatstone bridge circuit. Out of these the best sensor circuit was the op Amp circuit because it show accurately how light intensity falls as the distance from it increases. The basic equipment contained in the school limited me. However I successfully completed what I aimed to do, and have received a fairly good set of results.
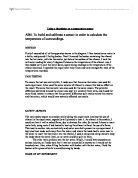
EVALUATION.
I believe that overall I planned and considered the whole of my experiment well and many rational decisions were based on the short time frame faced. But no experiment is completely perfect and there are always aspects upon which can be improved. One of these is to have more time to complete more averages to rule out mo0re experimental error. More accurate measuring devices that measure to more decimal places could also improve the experiment.
-The main aim in my experiment was to measure light intensity. I should have received better results from the dark room in which the light of the bulb should disperse to be able to decrease in concentration (intensity). With my black tube the light was channelled so the light wouldn’t be dispersed as much, this is why the results didn’t alter much as the distance became greater between the bulb and sensor. To decrease this a dark room should have been used or, the distance should have been longer and results taken every 20mm or 30mm.
-I notice that the tube was obviously darker than first thought because when the bulb was turned off the voltage read 0V, when the photodiode was fully in the tube.
-The photodiode was so sensitive to it’s surroundings that each time the next test was done out of the 3 in each circuit (usually in different lessons) the results changed because it is sensitive to infrared which varies in different weather conditions e.g. If it is a cold day the heat will move from an area of high heat concentration to an area of low heat concentration. But on a hot day, or in the afternoon, when the temperature has risen due to the heating system, there would be less escape of heat because the room temperature would cause the inside of the tube to rise by radiation through, from an area of high concentration to an area of low concentration. However the results couldn’t be done all in one lesson because there is limited time and the bulb would over heat causing more anomalies. The best way would be to do the full experiment all in one morning and turning the bulb off after each of the three tests. Also to leave it 15 minutes before each experiment.
-To get more of a range it would be better to take a measurement at 0mm because I noticed that the largest leap of voltage was between 0mm and 10mm. Because of this range it may have been better to record only up to 50mm but record it every 3 or 5mm between this distance. This would then have ruled out the anomalies of little change in the middle of my results- where there was no clear pattern (at around 60mm to 80mm).
I would also make sure that I check the voltage reading and the current reading at regular intervals if I did the experiments again.
Further investigations for my aim;
1 Investigate the effects of how the angle from the sensor to the light affects the readings.
- Explore how surroundings affected my sensor.
- Form another circuit which incorporates the best parts of the wheatstone bridge circuit and the op amp circuit as shown below.
- The affect of current could be researched. Current could be measured by the ohm’s law equation to help give another accurate measurement of the resistance rather than the round about way used in the potential difference formula that I used to work out what the resistance should have been.