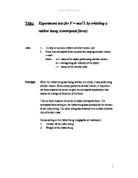
Measurements of the period were calculated by measuring the time taken for ten rotations, and this proved easier to measure than one rotation, and then divided by ten. Glass was chosen as a material for the cylinder to reduce the energy lost due to friction between the top of the cylinder and the string; this will help increase the reliability of the final results. In this experiment it proved quite difficult to be consistent though out all the experiment so therefore if there were any obvious errors in a particular result due to the string getting caught on something etc., then the test was repeated.
Experiment Diagram
Results
Graphs
From looking at the graphs it can be seen that a trend line can be plotted fairly easily through the points which demonstrates that relationships in each case are fairly strong. I can infer from these graphs that they shall be fairly useful in demonstrating whether the relationship of F= (mv2))/r is true as it shall allow us to compare values obtained from the gradients of the graphs above to the values calculated by the formula in this case.
Analysis
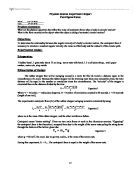
Mg=F = (mv2)/r = (m4π2r2)/rt2 = (m4π2r)/t2
For the 1 over t2 against mass graph: the gradient = (Ff + Mg) / (4π2m) which can be related the equation of a straight line y = mx + c or more importantly the gradient of the line of best fit. The lowercase m in the equation for the gradient (Ff + Mg) / (4π2m) is in fact the mass of the bung. When the value of t or the gradient gets bigger the value of v in the equation gets smaller.
On the graph 1 over t2 against mass, it can be expected that where the line of best fit intercepts the y as is in fact the Ff force. This means that Ff in fact equal c from the equation of a straight formula as it is in fact the intercept. The force is in fact due to the friction between the string and the glass cylinder which explains why the line of best fit does/does not when extended go through the origin.
Substituting values into the equation gradient = (Ff + Mg) / (4π2m).
(0.0045 + 9.8) / (4*π2*13.6) = 0.018
0.018 is fairly close the gradient of the graph 1 over t2 against mass which is 0.0152.
Using a different formula 4*π2*m*r and comparing it to the value of gradient for the first graph, period squared against radius, one should get a similar value.
4* π2*0.136*0.3 =1.61 which is relatively close to 1.26.
Summary
From the results I was able to find that values of gradients from the graphs were in fact relatively similar to those that could be found using the different formulas. However it can be observed that somewhere in the results/working one is a factor or ten out; however it does not seem that obvious to one who has looked hard as to where that discrepancy is and how it can be fixed. Overall it could be said that the experiment was a success in proving that the relationship F= (mv2))/r is true. This can be said from looking the proportional relationships displayed on the graphs and the similarities of the gradients of the graphs and the values calculated from the formulas.