Plants need copper for processes such as, photosynthesis, respiration, protein synthesis, lignification of cell walls and the formation of pigments. It is also part of the molecule of some enzymes and ethene receptors.
Copper in plants is required in very small amounts; it is a trace element and accounts for 4-30 ppm (parts per million) of the approximate percent of dry weight in plants (Raven and Johnson 1999).
Copper is found naturally in rock, either in its pure form or in compounds. Human activity accounts for much of the copper found in air, soil, and water. Industrial operations such as smelters, power stations and incinerators emit copper into the atmosphere, where it can return to the earth in precipitation. Water can also be polluted by a number of other copper sources as well, including agricultural runoff from farms using copper-based pesticides. Excess copper can also be found in copper mines and refineries.
Copper sulphate and copper oxide are two important copper compounds used in industry and agriculture.
It should be noted that metals such as copper are essential elements but they become toxic if present in too high a concentration.
Excess copper can cause reduced growth in plants as well as reduced photosynthesis due to the destruction of chlorophyll a, reduced respiration, nitrogen fixation and severe membrane decomposition.
Copper is also known to disrupt the tertiary bonds in some enzymes, therefore altering the active sites and inhibiting the enzyme.
An enzyme is a biological catalyst, which speeds up chemical reactions. They are globular, three-dimensional proteins that have a uniquely shaped region, called an active site. Most enzymes are specific and only work on one substrate.
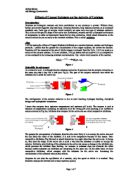
Fig 5: The Mechanism of Enzyme Action
It is thought that when a substrate combines with an enzyme it changes the shape of the active site slightly. The amino acids making up the active site are shaped into an exact form and the enzyme can carry out its function more effectively. In the process the enzyme also distorts the substrate allowing the reaction to happen more quickly. Once the products are formed they no longer fit the active site, they diffuse away and the enzyme shape returns to normal. This is known as the induced fit theory.
Fig 6: The Induced Fit Hypothesis
Copper is a non-competitive inhibitor in enzymes and acts efficiently on the enzyme amylase. Non-competitive inhibitors bind to the enzyme in a location other than the active site, changing the shape of the enzyme and making it unable to bind to the substrate.
Most non-competitive inhibitors bind to a particular area of the enzyme called the allosteric site. Alternatively, some activators can bind to the allosteric site and keep the enzymes in their active shape, thereby stabilising the enzyme.
Fig 7: Non-competitive Inhibition of an Enzyme
Calcium is an activator and stabiliser of the amylase enzyme. Calcium ions bind to a site on amylase making the enzyme structure more rigid and less likely to be denatured or broken down in high temperatures.
Copper ions can displace the calcium and bind to the amylase, this causes the enzyme structure to change so the substrate can no longer fit into the active site, and this is called a conformational change.
The copper disrupts the tertiary bonds of the enzyme and combines with the thiol groups, breaking the disulphide bridges and hydrogen bonds that give the enzyme its shape.
As the amylose can no longer be metabolised by the inhibited amylase the food store in the cotyledons cannot be broken down. This in turn prevents the embryo from using the carbohydrates to respire and produce the energy needed for germination.
Copper also inhibits the formation of chlorophyll for a similar reason, higher levels of copper result in a reduction in germination, lack of growth of the radicle and plumule and the cotyledons appear purple.
Null Hypothesis
There will be no significant difference in the number of broad bean seeds germinating at different concentrations of copper sulphate.
Alternative Hypothesis
An increase in copper concentration will disrupt the tertiary bonds in the enzyme amylase, therefore altering its active site and inhibiting the enzyme and this will result in less broad bean seeds germinating.
Variables
Copper sulphate concentration – as this will change.
Germination state of the broad bean seed.
The seed will be recognised as having germinated if the radicle is present.
The temperature the test tubes are stored at should be the same for all test tubes.
The amount of liquid (water/copper sulphate) placed into the test tubes should be kept the same.
The same number of broad beans will be used for each concentration of copper sulphate.
Apparatus
Method
- Using a graduated pipette, make up solutions of distilled water and copper sulphate as follows:
Pipette 200ml of the 130000mg/l copper sulphate solution into a 500ml beaker or jar. Label the beaker solution A.
Remove 20ml of solution A and pipette into another 500ml beaker. Add 180ml of distilled water to make a 200ml solution. This will be solution B.
Remove 20ml of solution B and pipette into another 500ml beaker. Add 180ml of distilled water to make a 200ml solution. This will be solution C.
Repeat this process using 20ml of solution C to make solution D and so on until you have solutions A, B, C, D, E, F and G.
When you have made solution G, remove 20ml if it and discard. This will ensure that you are left with 180ml of solution G.
To make solution H put 180ml of distilled water into the final 500ml beaker.
N.B. See Appendix for solution concentrations and explanation.
- Soak 10 broad beans in solution A for 30 minutes, this will allow the seeds to take up the solution and swell. The swelling of the seed splits the testa in order for the radicle to emerge. Repeat this for solutions B to H.
- Remove the broad beans and roll each square of filter paper into a tube and place into each of the beakers.
- Place all ten broad beans between the filter paper and the beaker above the level of the solution. Ensure that the broad beans that had been soaking in the solution marked A go into the beaker marked A and so on. By placing the broad beans between the filter paper and the beaker above the level of solution this ensures that the seeds do not get waterlogged and that they can obtain oxygen.
- Repeat steps 2 to 4 another three times so there are 4 beakers containing solution A with 10 broad beans in each. Repeat this for solutions B to H. This ensures that 40 broad beans are tested for each concentration of copper sulphate solution.
- Leave the test tubes for a week before returning to collect growth results.
- Broad bean seeds should be marked as having germinated if the radicle is present.
Safety
- Take care when using the copper sulphate solution as it is toxic
- Do not eat any seeds or plants
Calculating the Standard Deviation for each Concentration of Cu2+ Ions (mg/l) – Raw Data
The standard deviation is a measure of the variation of a population. Its calculation is based on the extent to which individual values vary from the mean. Where there is little variation between individuals the standard deviation will be small and where the variation is high it will be large.
Where:
Note – The mean values and standard deviation have been shown to 3 decimal places, full values were used in calculations
Calculating the Standard Error for each Concentration of Cu2+ Ions (mg/l) – Raw Data
The standard error is another important measurement of spread; it shows how certain it is that the calculated sample mean is the same as the mean of the population sampled from.
Each sample of a population would not have the same mean; this is due to chance or variation. To make the sample mean as close to the actual mean a large sample of a population is studied.
Where:
Calculating the Upper and Lower Limits (Error Bars) for each Concentration of Cu2+ Ions (mg/l) – Raw Data
We can be 95% confident that the actual mean of the population lies between the calculated upper and lower limits. Each sample of a population will not have the same mean.
The upper and lower limits for each concentration are found by:
- Multiplying the Standard Error (for that concentration) by 1.96
- Then adding or subtracting this value from the mean (for that concentration)
0 x 1.96 = 0
Therefore: mean +/- 0
0.1870439051 x 1.96 = 0.366606054
Therefore: mean +/- 0.366606054
0.1707469431 x 1.96 = 0.3346640085
Therefore: mean +/- 0.3346640085
0.1707469431 x 1.96 = 0.3346640085
Therefore: mean +/- 0.3346640085
0.2645200274 x 1.96 = 0.5184592537
Therefore: mean +/- 0.5184592537
0.9689042834 x 1.96 = 1.899052395
Therefore: mean +/- 1.899052395
1.058080114 x 1.96 = 2.073837028
Therefore: mean +/- 2.073837028
0 x 1.96 = 0
Therefore: mean +/- 0
Note – The mean values, standard deviation, standard error and upper and lower limits have been shown to 3 decimal places,
full values were used in calculations
Calculating the Log Values of Concentration of Cu2+ Ions (mg/l)
As the values of the concentration of Cu2+ ions are extremely far apart I am using the calculated log values to plot a graph. This provides a workable scale whilst still showing a true representation of the values.
The calculated log values are as follows:
Note – Anomalous results shown in red have not been included in the final average
Calculating the Standard Deviation for each Concentration of Cu2+ Ions (mg/l) – Anomalous Results
Where:
Only one anomalous result was found, this was for beaker 7
Instead of the result reading as 8 as follows:
This result should be removed, which in turn would change the mean as shown below.
Calculating the Standard Error for each Concentration of Cu2+ Ions (mg/l) – Anomalous Results
Where:
Only one anomalous result was found, this was for beaker 7
On the previous page I have calculated the Standard Deviation to be 0.
This alters the Standard Error as follows:
Calculating the Upper and Lower Limits (Error Bars) for each Concentration of Cu2+ Ions (mg/l) – Anomalous Results
The upper and lower limits for each concentration are found by:
- Multiplying the Standard Error (for that concentration) by 1.96
- Then adding or subtracting this value from the mean (for that concentration)
Only one anomalous result was found, this was for beaker 7
On the previous page I have calculated the Standard Error to be 0.
This alters the Upper and Lower Limits as follows:
0 x 1.96 = 0
Therefore: mean +/- 0
Note – The mean values, standard deviation, standard error and upper and lower limits have been shown to 3 decimal places,
full values were used in calculations
Note – Only one anomalous result was found, this was for beaker 7. Recalculated values have been used in the graph.
Analysis
I have decided to use the graph shown in Figure 15 to analyse my results. I feel that this graph presents a more precise overall view due to anomalous results having been removed.
From the graph it can be seen that as the concentration of copper ions increased the mean number of cress seeds that germinated decreased.
The error bars on the graph overlap from 0.06 mg/l copper sulphate solution right through to 60.0 mg/l copper sulphate solution (Log values -1.222 and 1.778 on the graph). The mean number of cress seeds wavers but does not deviate below 9.
The value of 0.0 mg/l copper sulphate is not shown on the graph but this too would overlap with the results above. Whilst not having error bars the mean would lie on the same fairly straight line.
The mean number of cress seeds that germinated at 600.0 mg/l copper sulphate solution (Log value 2.778) has error bars, which do not overlap with another values. This appears on the slope of the graph.
At 6000.0 mg/l and 60000.0 mg/l (Log values 3.778 and 4.778) copper sulphate solution the mean number of cress seeds that germinated is zero, no error bars are present.
Conclusion
As mentioned earlier, an enzyme is a biological catalyst, which speeds up chemical reactions. They are globular, three-dimensional proteins that have a uniquely shaped region, called an active site. Most enzymes are specific and only work on one substrate.
The structure of a protein is due to fairly weak ionic and hydrogen bonds and any agent, which breaks these bonds, will cause the three-dimensional shape to be changed.
Copper is a non-competitive inhibitor in enzymes and acts efficiently on the enzyme amylase. Non-competitive inhibitors bind to the enzyme in a location other than the active site, changing the shape of the enzyme and making it unable to bind to the substrate.
The copper disrupts the tertiary bonds of the enzyme and combines with the thiol groups, breaking the disulphide bridges and hydrogen bonds that give the enzyme its shape.
At lower concentrations of copper sulphate solution more cress seeds germinated. The seed can tolerate lower levels of copper, as it is an essential trace element. A vast amount of the enzyme amylase is activated by the hormone gibberellic acid and there is not enough copper to actively bind to all the amylase.
From 0.0 mg/l to 60.0 mg/l copper sulphate solution, most seeds germinated and the few that didn’t may have been dud seeds, the copper ions may have had no effect. Copper accounts for 4-30ppm of the approximate percent of dry weight in most plants so it is fairly reasonable to assume that this particular seed can tolerate levels ranging to 60ppm.
At these lower concentrations all the error bars overlapped, this implies that the mean number of cress seeds that germinated at these concentrations are similar, all the means lie between the same values and are not different. This is due to chance and variation within the species.
Between 60.0 mg/l and 6000.0 mg/l copper sulphate solution the mean number of cress seeds that germinated starts to fall at a steady rate. As more copper ions are available they bind to the amylase; this is an irreversible process. As copper does not affect all of the amylase, the enzymes that have not been inhibited continue to break down starch and provide energy for the embryo.
At a concentration of 600.0 mg/l copper sulphate solution (Log value 2.778) the error bars did not overlap with another values. This is significant as it shows that copper concentration is responsible for the lack of germination.
At concentrations of 6000.0 mg/l and 60000.0 mg/l no cress seeds germinated, either the copper ions which are abundant have combined with all of the amylase produced or there is not enough active amylase to produce sufficient maltose to be broken down into glucose and respired by the embryo.
At extremely high concentrations of copper sulphate solution the amylose can no longer be metabolised by the inhibited amylase and the food store in the cotyledons cannot be broken down. This in turn prevents the embryo from using the carbohydrates to respire and produce the energy needed for germination.
There were no error bars at the higher concentrations of 6000.0 mg/l and 60000.0 mg/l copper sulphate solution, this is significant as it shows that this is not due to chance but some other factor notably the high concentration of copper ions.
Whilst not shown in the results, seeds that germinated at lower concentrations displayed both a radicle and plumule (0.0 mg/l to 60.0 mg/l).
At a concentration of 600.0 mg/l copper sulphate solution the seeds that had germinated possessed for the main part only a radicle and at concentrations of 6000.0 mg/l to 60000.0 mg/l copper sulphate solution the seeds did not germinate at all.
This shows that as the concentration of copper increased less of the starchy food stores were broken down or broken down at a slower rate resulting in less growth or no growth at all.
Accept or Reject Null Hypothesis
‘There will be no significant difference in the number of cress seeds germinating at different concentrations of copper sulphate.’
From the table shown in Figure 12 (anomalous data) and the graph shown in Figure 15 (anomalous data) it is seen that less cress seeds germinate as the concentration of copper sulphate increases. The most significant value occurred at a concentration of 600.0 mg/l copper sulphate solution (Log value 2.778). The error bars on the graph did not overlap with other values showing that copper concentration is responsible for the lack of germination.
Therefore I can reject the null hypothesis and in turn accept the alternative hypothesis:
‘An increase in copper concentration will disrupt the tertiary bonds in the enzyme amylase, therefore altering its active site and inhibiting the enzyme and this will result in less cress seeds germinating.’
Sources of Error
Anomalous results are identified in Figure 12. These may have occurred in a number of ways.
The filter paper in each beaker may have had different wick lengths and widths, thus allowing more or less solution available to the seed. Different beaker sizes may also have contributed to this.
Crystallisation of the copper sulphate took place on top of the filter paper in some beakers; this would be due to evaporation. The relative influence of the high concentration of copper crystals on the filter paper would have affected the amount of copper taken in by the seeds. Some of the beakers may have dried out. This could be overcome by checking solution levels in the beakers at various stages throughout the experiment and adding solution as required.
Errors may have occurred when performing the serial dilution; some solutions may not have been mixed correctly before dilution occurred.
The temperature in the storage room for the experiment may have fluctuated due to central heating and drafts from windows or doors. This would have a minimal effect of the experiment and would have affected all the cress seeds, as they were stored in the same room.
Some of the cress seeds grew with their radicles or plumules intertwined and these may have been broken or counted as growth on a different seed when they were been counted. This is also a minimal effect as this occurred when a high percentage of the seeds were germinating and would not have affected counting small numbers of germinated seeds.
If larger seeds had have been used for the experiment it would have been easier to see the radicle even if they had been intertwined.
Errors could be reduced by storing seeds in a constant environment and checking on solution levels to prevent drying out.
Reliability
I believe that my results are quite reliable. The curves in both Figure 11 and Figure 15 are fairly similar. A very noticeable difference occurs at 6000 concentration of Cu2+ ions (Log value of 3.778 on the graph) where one anomalous result was observed. This was the only anomalous result recorded.
Whilst some errors may have occurred during the experiment, I believe that they did not affect the reliability of the investigation.
As the experiment was repeated a number of times for each concentration of Cu2+ ions (mg/l) and most of the results were alike the reliability of the experiment is shown. I believe that this experiment is valid.
The background information on how the food stores in dicotyledon seeds are broken down and the effects of copper also tie in with the results.
Further Experiments
This experiment could also be conducted by placing starch, amylase and different concentrations of copper ions in a beaker. The amount of starch remaining could be measured by staining with iodine after certain periods of time have elapsed.
Also, it would be possible to study the effect of temperature on germination or with another essential metal.
Appendix
Copper accounts for 4-30ppm (parts per million) of the approximate percent of dry weight in most plants (Raven and Johnson 1999).
Assuming that this is a tolerable or optimum amount of copper, the broad bean seeds should germinate best at this concentration.
I will use a copper sulphate solution as it is used in industry and agriculture and it is readily available.
To find the optimum concentration of copper sulphate solution the ppm are converted to mg/l as follows:
- 1ppm is equal to 1mg/kg in soil
- 1ml of water is equal to 1g
- Therefore 1ppm is equal to 1mg/l
Using the middle value of the approximate dry weight of copper in most plants should provide an average concentration.
30 – 4 = 26
26 ÷ 2 = 13
Therefore 13ppm
- The optimum copper concentration should be around 13mg per litre of water.
Different concentrations of copper sulphate solution need to be made up in order to investigate the effect of copper sulphate on germination. To do this, perform a serial dilution.
The concentrations of solutions we require are as follows:
The serial dilution should be performed as follows:
By removing 20ml of the previous solution, each beaker will contain 180ml.
Discard 20ml of solution G so it too will contain 180ml of solution.
Solution B is one tenth as strong as solution A and so on.
To make solution H add 180ml of distilled water to the final beaker.
Bibliography
-
O’Neill, P. (1998) Environmental Chemistry. 3rd Edition. London: Blackie Academic & Professional
-
Raven, P. H. & Johnson, G. B. (1999) Biology. 5th Edition. London: WCB/McGraw-Hill
-
Rowland, M. (1992) Biology. Surrey: Thomas Nelson and Sons Ltd
- http://barrygray.pwp.blueyonder.co.uk/Tutoring/PlantN.html – accessed on 16 February 2005
- http://www.cda.org.uk/megab2/general/tn35/sec511.htm – accessed on 17 February 2005
- http://www.dartmouth.edu/~toxmetal/TXQAcu.shtml – accessed on 17 February 2005
- http://www-saps.plantsci.cam.ac.uk/recors/rec219.htm – accessed on 16 February 2005
- http://www.uq.edu.au/_School_Science_Lessons/BioPHYWEP12.html#412.10 – accessed on 17 February 2005