-
Inhibition – Inhibitors compete with the substrate for the active sites of the enzyme (competitive inhibitors) or attach themselves to the enzyme, altering the shape of the active site so that the substrate is unable to occupy it and the enzyme cannot function (non-competitive inhibitors). Inhibitors therefore slow the rate of reaction. They should not have affected this investigation, however, as none were added.
-
Enzyme cofactors – Cofactors are none protein substances which influence the functioning of enzymes. They include activators that are essential for the activation of some enzymes. Coenzymes also influence the functioning of enzymes although are not bonded to the enzyme. Unless enzyme cofactors were present in the liver tissue
Biology Substrate Experiment
Gopal Makwana 12AT 04/05/07
containing the catalase, they were not included in this investigation and therefore would not have affected the rate of reaction and the results of this experiment.
-
Enzyme Concentration – Provided there is an excess substrate, an increase in enzyme concentration will lead to a corresponding increase in rate of reaction. Where the substrate is in short supply (i.e. it is limiting) an increase in enzyme concentration has no effect.
-
Total amount of Liquid – This is the total amount of liquid in the experiment. I will always have the same amount in balanced quantities i.e. if I use 16cm cubed of water I shall put in 4cm cubed of hydrogen peroxide so the total amount of the solution is a certain amount.
-
Same type of liver – I shall use the same type of lamb liver for all the experiments as different parts of the liver may react differently in the experiment. So to keep the experiment a fair one the same type has to be used in order for the reaction to be the same.
-
Repetition – The experiment must be carried out three times in order to get an average set of results and rid of any anomalous results I may have got.
-
Apparatus – The same type of apparatus will be used in order for the experiment to be the same.
Apparatus List:
To test out how the concentration of hydrogen peroxide affects the rate of reaction first set up the apparatus and prepare the different concentrations of hydrogen peroxide as below:
Biology Substrate Experiment
Gopal Makwana 12AT 04/05/07
- Using the scalpel take a sample of liver cut this piece in cm intervals using the scalpel and ruler. Also make the different substrate concentrations.
- Set up the apparatus so that the gas is collected from the conical flask to the gas syringe once the reaction is stated.
- Measure the volume of oxygen evolved in a time of 1min. This is the time I want to time the reaction for as within the first minute is when the reaction is at its fastest and most aggressive. This is the time in which the most gas will be given off.
- Wash out apparatus and then repeat the procedure with the other Hydrogen Peroxide solutions.
- Repeat all he tests at least three times (Time dependent) so that an average can be obtained. Repeating the experiments several times will help to produce better and more accurate results, as any inaccuracies in one experiment should be compensated for by the other experiments.
- Place the results in a table of results. The equation for the average concentration is:
Volume
Time
I predict that as the substrate concentration increases, the rate of reaction will go up at a directionally proportional rate until the solution becomes saturated with the substrate hydrogen peroxide. When this saturation point is reached, then adding extra substrate will make no difference.
The rate steadily increases when more substrate is added because more of the active sites of the enzyme are being used which results in more reactions so the amount of oxygen released in a given time is higher. Once the amount of substrate molecules added exceeds the number of active sites available then the rate of reaction will no longer go up. This is due to the maximum number of reactions being done at once, so any extra substrate molecules have to wait until some of the active sites become available.
In the experiment I had to make a few changes. These were to make the experiment better on the teacher’s advice or the correct apparatus was not available in the school laboratory.
- I cut the liver into pieces and weighed them so each piece was one gram in mass. After cutting the liver I used the pastel and mortar to grind the liver to give it a greater surface area so the reaction would be helped. When the liver was getting grinned I added a pinch of sand to stop the liver from becoming totally liquid.
Biology Substrate Experiment
Gopal Makwana 12AT 04/05/07
- I had to use a measuring cylinder to measure the amount of gas given off because there weren’t enough gas syringes in the school laboratory. The gas syringes also break very easily if too much gas goes into them so we had to use the measuring cylinders.
- Gloves were worn throughout all the experiment because the hydrogen peroxide is corrosive and thus safety precautions were taken in event of any accidents.
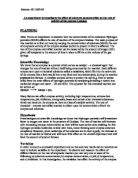
- The solutions that I used for the experiments were hydrogen peroxide and distilled water. The different concentrations of the solutions that I used were
In order to decide how varying the substrate concentration affected the decomposition of the enzyme (liver), the rate of reaction was measured. When the solutions and the liver were placed in the conical flask the stopwatch was started once the rubber bong was sealed.
In the conical flask it was clear that a reaction was taking place by the observation of bubbles of oxygen gas being released creating a ‘fizzing’ in the conical flask.
I calculated the average amount of gas by adding the three experiments together and dividing by three. I got the reaction rate by dividing volume over the time. The time was one minute as this is how long the experiment was left for.
Biology Substrate Experiment
Gopal Makwana 12AT 04/05/07
From the table of results I can that as the concentration of hydrogen peroxide is increased, the rate of reaction is also increased. When no substrates were added there was no reaction, and as you can see from the table above the reaction was increasing in a near directly proportionally way.
Rate of Reaction = Grater Substrate Concentration the Faster the Rate of Reaction
On the graph that I have plotted only two of the results do not follow the line of best fit. These are when the substrate concentration was 20% and 100%, the others are on the line of best fit showing the results to be directly proportional if there were no anomalous results. I would not call the results for the 20% and 100% experiments anomalous as they follow the same trend and are true, they are just not on the directly proportional line.
With an increase the concentration of Hydrogen Peroxide, the number of active sites increases, hence, makes a faster reaction. The theoretical maximum rate of reaction is when all the sites are being used but in reality this theoretical maximum is never reached due to the fact that not all active sites are being used at the same time. The substrate molecules need time to join onto the enzyme and to leave it so the maximum rate achieved is always slightly below the theoretical maximum. The time taken to fit into and leave the active site is the limiting factor in the rate of reaction.
There were a number of factors in the experiment that would have caused improper results. These are mainly due to the apparatus that was used. This is the way the actual experiment was set up and the actual apparatus that was used in the experiment. Human error has also led to ‘false’ results.
- Measuring Cylinders – Most of the measuring cylinders that were used in the experiment were not satisfactory. There were many problems created by them in the experiment. First of all most of the cylinders were not graded at the bottom so it was very hard to determine exact volumes of gas that were released because there were no means to tell. Getting the cylinders into the tub of water was also difficult and took several attempts in some cases as if the water is released there is no means of knowing how much gas is collected. So if some air were let into the cylinders accidentally it would have gave greater results, as the amount of air in the cylinder is equal to the results. To overcome the measuring problem I would use a different way of measuring the gas produced. I would use the gas syringe as I stated in my original method.
Some of the oxygen may have also got dissolved into the water of the measuring cylinder so to overcome this problem a gas syringe would have to be used. As you can see there are many problems associated with using the measuring cylinders from measuring the amount of gas given off.
- Accurate Balance – This also was not accurate as the liver was weighed to one gram before the sand was added and grinned up. The sand was not weighed it was just a
Biology Substrate Experiment
Gopal Makwana 12AT 04/05/07
- pinch that was used. Once the liver was grinned with sand the mass has changed and the new mass is unknown and was most probably different in all the experiments that were carried out. When the liver was placed into the conical flask it was also very difficult to take all of the liver form the pastel and put into the conical flask. Some pieces were left in the pastel while some were left stranded on the sides on the conical flask. So in all the experiments the masses of the liver would have been different not making it a fair test and so the results are bound to be different. The grinding should be done before the weighing so it can be the same in each experiment, the same amount of sand must also be mixed n all sample of the liver. Instead of using liver pieces that have slight variations in size, and volume of catalase, as a source for the enzyme, a one molar solution of the enzyme could have been used. This way the concentrations and enzymes can be measured far more accurately reducing the chances of errors in the investigation
- Measuring Solutions – The measuring of the different concentrations may have been slightly different in every experiment only by a very small amount. Although the measuring cylinders were quite accurate there would have been human error, that cause the measurements to be slightly out. If I used more precise measuring equipment it would also reduce the human error in reading the measurements.
- Washing of Equipment – The equipment that I used should have been washed after every experiment but this would have been very unpractical as it would have taken up too much time and there wouldn’t be enough time to carry out the experiment. There would have been traces of hydrogen peroxide left in the conical flask this would have lead to incorrect amounts of the substrate. The pastel and mortar were also not cleaned this would have lead to wrong proportions of the liver. To overcome this the conical flask in particular has to washed out properly and also dried to prevent any excess liquid entering it.
- Time – The experiment was left for only one minute. I do not feel as this was enough, as although the most productive time of a reaction is within the first minute I think that there was not enough time for the gas to reach the measuring cylinder. This is because as I was writing the results down I noticed that a lot more gas was going into the cylinder. I would change the time scale about three minutes to give the gas time to get measured.
- Human Reactions – The reaction starts as soon as the liver meets the hydrogen peroxide. The bong must be placed on the conical flask as soon as possible to collect all the gas released. In most of my experiments the bong was not placed on immediately so gas was lost. Basically I would have to get familiar with the apparatus so I can do it quickly.
- Repetition - Also as I repeated the experiments so many times the later experiments will be more accurate as everything becomes more familiar then the first attempts. In this experiment six different substrate concentrations were
Biology Substrate Experiment
Gopal Makwana 12AT 04/05/07
tested. However, although there were a large ranges in between the concentrations. The rate of reaction can be predicated from the graph at the points that were not tested. In a future investigation, a far greater number of substrate concentrations between those already recorded should be tested reducing the extent of any anomalies on a graph where the line of best fit must be drawn. I would recommend using 5% differences instead of 20% ones that I used. The experiment can also be repeated a further times, the greater number of times a experiment is carried out the better as this gives a much better average and would nearly completely remove all anomalous results.
From looking at the results and summarising the limitations of the experiment I feel as if I can come to a conclusion to the aim of the experiment. The aim was ‘Design an experiment to investigate the substrate concentration on the rate of activity of the enzyme catalase.’
Basically the firm conclusion is that as the substrate concentration is increased the rate of activity for the enzyme is also increased. I cannot say that if it is directly proportional from the results I have got, as the experiment would have to be redone with the suggestions that I have put forward as the limitations in the experiment.