Volume of Na2S2O3 and HCl
When changing the concentrations the volume will all so change. I will fill the rest of the volume with water to keep a constant overall volume to avoid a presence of another variable.
Variables for method 1
Dependent variable – will be the time taken in seconds for the cross, under the conical flask, to disappear completely.
Independent Variable – the independent variable for this method will be the concentration of the Na2S2O3 . I will vary the concentration by diluting it with water. I will have five different concentrations. This means they will have different volumes, in this case water will be added to fill the rest of the volume to insure the overall volume remains the same for all five concentrations.
Control variable-- I will keep the concentration of the hydrochloric acid the same throughout this method. The reason for this is in order to find the order of reaction with respect to Na2S2O3 I will need to keep the other reactant in this case it is HCl. I will also try to do the experiment under room temperature. I will also use the reactants from the same container to avoid any change in concentrations.
Variables for method 2
Dependent variable – will be the time taken in seconds for the cross, under the conical flask, to disappear completely.
Independent Variable – the independent variable in this method will be the concentration of the HCl. I will carry out the same procedure as in method 1 but instead of changing the concentration of Na2S2O3 in here I will change the concentration of HCl.
Control variable-- I will keep the concentration of the sodium thiosulphate the same throughout this method. The reason for this is in order to find the order of reaction with respect to HCl I will need to keep the other reactant in this case it is Na2S2O3. I will also try to do the experiment under room temperature. I will also use the reactants from the same container to avoid any change in concentrations.
Determining the end of the reaction
To determine the end of the reaction I will be using a cross on a tile. I will place the conical flask where the reaction is going to be taking place on the tile and when the cross disappears I will stop the clock watch. It is important that the decision is made by the same person and the timing is also done by the same person, Each individual’s reflexes will affect how fast they react to stop the stopwatch. And also the eyesight of the person will determine when the cross has disappeared. So therefore the same person will start the stopwatch and stop it. I will also use the same tile with the same size cross on it. Because if the crosses were in deferent sizes this could affect when to determine the end of the reaction.
Justification for the volumes and concentrations used.
In my experiment I will use different volumes to what the teacher used in the demonstration. The reason for this is in the demonstration the reaction took place in a short time. The teacher was using 50cm3 of Na2S2O3, 20cm3 of water and 5cm3 of HCl. And the reaction took 18.20seconds. This means the error would be greater as the time is short because of the reaction time of the person timing it. In my experiment I will start with 25cm3 (Na2S2O3/HCl) and decreasing that by 5cm3 for every reaction. This will make the reaction go slower then in the demonstration. And makes it easier to time and obtain more accurate results. I will also be decreasing the concentrations of the chemicals used this will in turn increase the time taken for the reaction leading to a decrease in the timing error.
Safety:
- Throughout the experiment safety goggles should be worn to avoid any contact with eyes.
- If Sodium thiosulphate comes in contact with eyes immediately flush the eye with gently running tap water for approximately 5minutes.
- If swallowed drink plenty of water, Seek medical attention if a significant quantity is swallowed.
- If the acid comes into contact with the eyes or skin, it can cause serious permanent damage. So therefore eye goggles should be worn at all times and cloves should be worn if desired. If come In contact with skin wash with water for a period of time.
- Avoid inhaling the acid. Therefore the experiment should take place in a well ventilated lab. If inhaled and starts to irritate leave the lab for fresh air.
-
Sulphur dioxide is produced as a product in the reaction and it’s toxic in high concentration and is a severe respiratory irritant at lower concentration. Some people, especially those prone to asthma, may be especially sensitive to sulphur dioxide.
- If sodium chloride comes into contact with eyes, it can cause irritation. flash the eyes with clean water.
Apparatus
-
three 50cm3 burettes- this will give more accurate readings.
- 100 cm3 conical flask this where the reaction takes place ( where the reactants will be mixed)
- a black cross drawn on a white tile- this will be used to determine the end of the reaction when it disappears.
- stirring rod- to stir the reactants ones the are added together
- stopwatch- this will be used to time how long it takes for the black cross to despappear.
- 3 x Clamp stands – this will be required to hold the burettes
Method
- Ensure safety
- Collect and wash all the equipment using distilled water to prevent any contamination.
- Place all the equipments where they are supposed to be. Three burettes using the clamps ect.
- Take note of the room temperature before starting the experiment.
- Label all the reactants used and the test tubes including the volumes which are going to be used.
- Fill up all the burettes with their solution.
-
Using the burettes and the reading from table 1 ( for method 1) fill the right amount of Na2S2O3 water in the test tube
- Using the burette which contain the distilled water fill the right amount into the same test tube(as above)
-
Now measure 5cm3 of HCl into the conical flask and place it on top of the white tile which is marked with the black cross.
- Get ready to start timing before adding the reactants together
-
Add the Na2S2O3 and the water you already measure in the test tube into the conical flask and start the stop watch
- Make sure you are looking from above to see the black cross and try to avoid inhaling the gas being released. And for the other concentrations make sure you are looking from the same point and try to stop the stop watch when the cross disappears.
- Stop the stop watch when the black cross has completely disappeared.
- Record the results in the table n seconds
- Wash the flask and thoroughly to avoid any contaminations for the next concentrations.
- Now repeat the experiment in exactly the same way for the other concentrations.
- After obtaining the results for method 1 and repeating the experiment at least two times and working out the average from that. This will make your results more reliable.
-
Now carry out the same procedures for the data on table 2 but now changing the concentration of HCl instead of Na2S2O3.
Table 1
Table 2
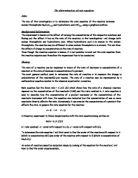
To work out the molarity of Na2S2O3/HCl I used a formula;
Md x Vd = Mc x Vc
e.g. for working out the molarity of Na2S2O3 when the volume used was 25cm3.
0.4 x 25 = ? x 25
0.4 x 25 = 0.40
25
By using the same formula and method you can work out the other molarities.
Results table
From these results I’m going to draw graph for rate against concentration. The reason I multiplied the rate by 100/1000 is to make it easier to draw an accurate graph. If I used small values it would be hard to plot the points on their exact values.
From my results I will draw the graphs for rate against concentration.
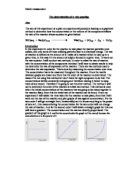
Determining the order of the reaction from graph 1
Now I will try to determine the order of the reaction with respect to Na2S2O3. As I have chosen to use the initial rate method to determine the order of the reaction I will use the shape of the graph.
After drawing the graph of rate against concentration for Na2S2O3 I obtained a straight line of best fit. The line of best fit shows that the rate is directionally proportional to the concentration. As the concentration increased the rate also increases in a proportional pattern.
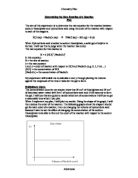
From the graph you can see that the reaction can’t be a zero order. As the concentration increases so does the rate of the reaction. This means the rate does not stay constant as the concentration changes. Looking the zero order reaction graph the line of best fit is horizontal. This eliminates the possibility that the reaction is a zero order.
From the graph I can also see it’s not a second order reaction because I got a straight line of best fit instead of a curve. And this also eliminates the possibility of the reaction of being a second order reaction.
Even though all my point aren’t very close to the line of best fit, some of them are scattered away from it but with in a suitable range. And this can conforms that the reaction is a first order reaction with respect to sodium thiosulphate.
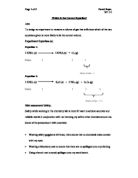
Determining the order of the reaction from graph 2
From my results I draw a graph of rate against concentration. Using the shape of the graph it will help me to determine the order of the reaction with respect to HCl.
The shape of the graph gave an impression the HCl is a first order reaction. Even though I got a straight line the points were scattered above and below the line of best fit. From the graph I can see that the rate is directionally proportional to the concentration. As the concentration increases the rate also increased in a constant pattern. This graph also eliminates the possibility of a zero order reaction because I did not obtain a straight horizontal line. Instead I got a directly proportional graph. as you use can see from the results table and the graph an increase in the concentration also results in a change in the rate of the reaction and this completely eliminates the possibility of a zero order reaction.
The graph is not a second order reaction because the line of best fit is not a curve. Even thought the graph does not have a very strong colorations, it would not make a curve as you can see the point are scattered above and below the line of best fit. Even if connecting the point together they would not make a curve.
After analysing both graphs and using their shape to determine the order of the reaction with respect to each other. Na2S2O3 and HCl. The shapes of both graphs show a first order reaction with respect to each other. From this I can determine what the rate equation would look like using the information from the graphs.
Rate equation:
Rate = k [HCl] [Na2S2O3]
Evaluation
While plot my graphs for rate against concentration using the results I have obtained from the experiment. I plotted the graph to the best degree of accuracy. As the line of best fit had to go though zero it made it harder to draw it and have an equal number of point on either sides. If I did the experiment more time I would have obtained more accurate and reliable results. If I had more then one result I would of being able average them out and maybe obtain accurate results. There were some anomalous results from the data collected. When the graphs were draw not all the point where close to the line of best fit, but they were in a suitable range. For the Na2S2O3 graph I didn’t have any clear anomalous results. All the points were in a suitable range to the line of best fit. For the HCl graph I had one anomalous result at a concentration of 0.8. This was an anomalous result because when the line of best fit was drawn the point was far away from the line of best fit and not in a suitable range. This anomalous could be caused by inaccuracy in the experiment.
Errors present in the measurement and procedure
To make sure I didn’t have anomalies result and they were accurate and reliable, I made sure the volume used where measured in the most accurate way possible. I used a 50cm3 burette to measure the volume of the reagents, this was more accurate equipment then using a measuring cylinder which measure to a lower degree of accuracy. To measure out all the solutions for each experiment I used separate burettes to avoid any contaminations, and they where washed with distilled water before they where used. I add the right amount of HCl and dilute it used the right volumes from the table, and pour them into the conical flask and then I measured out the sodium thiosolphate into a beaker. This was done because if I poured it directly from the burette the reaction will start to take place and I would have got completely inaccurate results. Even though I collected the sodium thiosolphate into a beaker first and then into the conical flask, not all the solution was poured into the conical flask. Some of it remained even if it was a small amount it would result in error. This could be improved in the future by using a digital burette. This will reduce the presence of error in measurement as it has a level of accuracy up to 0.01ml. The digital burette will also pour the required volume into the conical flask in a faster time. In my experiment I carried out five different reading. In the future I would carry out more to increase the reliability.
The other factor that played part in the reaction and could have resulted in an anomalous result was temperature. Although in my plan my aim was to keep record of the temperature. But this didn’t mean I would be controlling it. In the experiment I used a thermometer to measure the temperature. Thought out the experiment it was fluctuating. And the solutions used were not necessary the same temperature as the surrounding. This could be considered to be a significant error. As an increase in temperature leads in more kinetic energy, this gives particle more energy to move and collide fruitfully, this in turn will increase the rate of reaction and therefore a shorter time for the reaction to come to completion. And I also did the two methods in two separate days this result in deference in temperature. To improve this in the future I would use water bath and set it to the same temperature as the surrounding and place all the solutions I’m going to be using in the water bath. This will eliminates the presence of any factors that might affect the rate of the reaction, and therefore results in error. The most significant error in this experiment was timing the reaction and determining the end point of the reaction. It was hard to decide when to start the stopwatch and when to stop it. I t was very hard to judge whether the cross disappeared or not. As the solution started to get cloudy and the cross was about to disappeared there was at least a 5 second gap where the solution will be at the same intensity and this lead to the most significant error. Where you would be unsure whether the reaction has come to completion or not. In order to draw the graph the rate had to be worked out, dividing one by the time taken and if the timing error was around 5second this will be a major different in the value obtained and this will lead in anomalous results. So in the future to avoid this significant error I would use a colorimeter. I can also use a light sensor which more suitable for this type of experiment. This will measure the amount of light passing through the solution. The light sensor will have a fix point when to stop the timing. It will stop timing when the there is no light passing through the solution. And this will result in a more accurate and reliable results. If a calorimeter was used it would measure the amount of light adsorbed by the solution. An appropriate filter would be used allow only certain colour though. As the solution gets cloudy and starts to change colour the amount of light absorbed by the solution will also increase. When all the light is absorbed by the solution the timing should stop. To make this more accurate I will link the colorimeter to a data logger which is in turn linked to a computer where accurate timing will be recorded.
I can also stir the solution to help me obtain more reliable results. This will enable all the particles to interact with each other. To get the most out of this method will have use a machine that will stir all the solutions at the same speed.
Bibliography
Revise A2 chemistry by Heinemann- Graham Read and Ray Skwiercrzynski
Chemguide.co.uk
Wikipidia.org
Chemistry 2 OCR- Cambridge