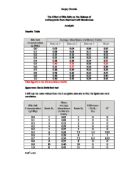
Graph 2 shows the average value of light absorbance taken from the three sets of data, plotted against the concentration of bile salt solution. We can observe that there is a similar trend to that of Graph 1, where as we increase the concentration of bile salt solution the light absorbance also increases proportionally, which is shows in a linear relationship between light absorbance and bile salt concentration.
Temperature- the temperature must be kept constant at room temperature 20oC-24oC or the proteins will denature.
Spearman Rank Test
Using the three sets of data and the average data, one can obtain more reliable result. After collecting these results, the statistical test can be used to find out whether there is a positive correlation between our sets of data. A positive correlation indicates, as the bile salt concentration increase so does the absorbance and therefore so does the rate of diffusion of the dye from the beetroot cells in to the solution of bile salt.
The Null hypothesis states bile salt concentration does not effect the diffusion of dye from the vacuoles of the beetroot cells.
The Working hypothesis state as the bile salt concentration increase so does the permeability of the membrane and therefore the absorbance by the dye.
Using the spearman rank test we can calculate the correlation coefficient. represented by Rs.
Rs = 1 shows a perfect positive correlation
Rs =-1 shows a perfect negative correlation
Rs = 0 shows the results to having no correlation
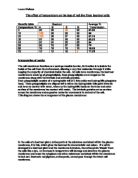
Table 3
Spearman Rank formula and calculations
Rs=0.97
In order to calculate if my data its 95 % accurate, i could use a statistical table to find out if the correlation is significant 5%. In order to get a positive correlation the Rs value should be greater than the critical value. The value of the Rs for 11 pairs of data at 95% probably is 0.61. The value of the correlation coefficient in my experiment is 0.97 which is greater than 0.61, therefore there is a positive correlation between the concentration of bile salt and the diffusion rate of dye from beetroot cells, I can then say my data supports my hypothesis with 95% confidence. Therefore I have rejected the null hypothesis and accepted the working hypothesis. The rest of the 5% was probability due by chance. The meaning of the statistical test signifies to us ,that we are 95 % confident that the bile salts are causing the removal of the protein from the membranes, thus releasing more anthocyanin through the tonoplast.
Conclusions
Diffusion of the beetroot discs dye in different bile salt concentration.
A vacuole is a membrane-bound organelle that usually contains liquid. All cells have vacuoles, but plants cells differ from animal cells in that their vacuoles are very large, permanent, and usually occupy a position fairly near the centre of the cell. The membrane surrounding a plant cell vacuole is often known as the tonoplast. Plants cell vacuoles contain many different substances in water. These include sugars, storage proteins, pigments such as anthocyanin found in a beetroot vacuole and enzymes. Vacuoles have a wide variety of functions. For example the colour of some flower petals are caused by the pigment held inside vacuole in their cell. The solutions on either side of a cell surface membrane are mixtures of water molecules and a wide variety of other molecules and ions. Cell wall, which is present in plant cells, is made of a carbohydrate called cellulose. This is a non-living, thick, rigid layer around the cell membrane, which helps the plant to support itself. As a result of cell wall, plants cell are distinct shapes-some may be angular, rectangular or round.
From the result obtained I can therefore say that as the concentration of bile salts increase so does the absorbance by the anthocyanin. The anthocyanin in the beetroot cell is present in the vacuole. The vacuole has a selectively permeable membrane called tonoplast. The more anthocyanin diffusing out, the intensity of the anthocyanin would increase. The intensity is measured as absorbance using a colorimeter .The higher concentration of bile salts, the absorption is higher. This is because bile salts have an affect on the cell of beetroot. The concentration gradient of bile salts is high on the outside of the cell and low on the inside and the concentration of anthocyanin is high in the vacuole but there is none outside of the vacuole. The cell of beetroot has a tertiary structure, which is important to the precise shape of the protein and it has a fully permeable wall, and a partially permeable membrane and tonoplast. It has a partially permeable membrane because if it were fully permeable chemicals inside the cell would mix with those outside the cell. This means that substance can get inside of the cell wall e.g. bile salts, but they cannot pass through the membrane. This is because the membrane is made of a phospholipid bilayer, which has channel protein, which allows substance to pass through by a concentration gradient. The higher absorption readings for higher concentration of bile salts in indicative of a breakdown of the membrane which is in holding with the fluid mosaic model of the membrane whereby at lower concentration of bile salts the membrane is tightly packed and gel like but at higher concentrations of bile salts it becomes less tightly packed and more fluid until eventually it losses its structure breaks down completely.
Memberane
Bile salts are steroids with detergents properties, which are used to emulsify lipids, which help them destroy the plasma membrane so it is possible to get to the vacuole. Lipids form non-polar structures that are insoluble in water so bile salts, which have non-polar and non-polar parts break these down. This is accomplished my emulsifying the lipids. As derivatives of cholesterol, bile salts have both hydrophilic and hydrophobic domains (amphipathic). On exposure to triglycerides, the hydrophobic portion of bile salts intercalate into the lipid, with the hydrophilic domains remaining at the surface. Bile salts attack the proteins in the plasma membrane and denature them. They destroy the tertiary structure changing their shape and hence their function. Bile salts can also remove protein making large gaps in the membrane, and they can destroy the bilayer arrangement, also creating gaps. The higher the concentration of bile salts the bigger gaps it makes. Once bile salts have destroyed the plasma membrane they attack the vacuole and pigment is released from the vacuole and goes down the concentration gradient into the liquid outside the cell.
Collision theory, theory used to predict the rate of chemical reactions particularly for gases. The collision theory is based on the assumption that for reaction to occur it is necessary for the reacting species (atoms or molecules) to come together or collide with one another. Not all collisions however, bring about chemical change. A collision will be affective in the producing chemical change only if the species brought together possess a certain minimum value of internal energy, equal to the activation energy of the reaction. Furthermore, the colliding species must be oriented in a manner favourable to the necessary rearrangements of atoms and electrons. Thus according to the collision theory, the rate at which a chemical reaction proceeds is equal to the frequency of collision can be calculated with some degree of accuracy only gases (by application of the kinetic theory), the application of the collision theory is limited to gas phase reaction.
This theory shows why at higher concentrations of bile salts, the absorption is higher. It is because at higher concentration of bile salts molecules collide with membrane more frequently therefore more damages is caused to the and more anthocyanin is released, making absorption readings higher. Amylase blinds with ester linkage at a special site known as the active site, which has a specific shape that will only fit that portion of the molecule-it is specialised. This is known as the lock and key hypothesis. Bile salt has no effect on the cell wall, which is made of cellulose, because it is full permeable to pigment and bile salt.