Apparatus
1.0mol.dm-3 Hydrogen Peroxide (will dilute to required concentration)
Pig liver
Yeast
sodium alginate
7.4 pH buffer
0.1 mol dm-3 calcium chloride
1.0mol.dm-3 ethanol(will dilute to required concentration)
Food Processor
Beakers
Stopwatch
Coarse filter
Distilled water
Syringe
Filters
Tweezers
Risk Assessment
The largest risk in my experiment is from the hydrogen peroxide, It is corrosive, can cause burns and is flammable if it comes into contact with a naked flame. I will take every precaution possible to stop this and all other chemicals being used in coming into contact with skin and especially my eyes. I will wear safety goggles and I will take a lot of care pouring and handling all the chemicals used in this experiment. I will also label all Chemicals and containers as hydrogen peroxide is colourless it could get confused easily with water. In case of contact with skin The affected area will be washed thoroughly with running water and if it come into contact with eyes a teacher will be informed immediately.
Handling the liver could cause infection as it could be carry disease organisms so gloves will be worn at all times I am in contact with it. When I am finished with it shall be disposed of in a biohazard bag.
Another major hazard is glass beakers getting broken they could easily cut someone these could be dangerous with all the chemicals around.
The immobilised catalase has a very small danger but I will still take great care in handling it. All normal lab safety rules also apply in this experiment like not eating in the lab and not running in the lab.
Control of Variables
In this experiment I am changing the concentration of ethanol. I will measure this out carefully each repeat using an accurate syringe. I will also use the same method for measuring the water to dilute the ethanol to the concentration I need.
I will have to keep all other variables the same as this way I will have a fair test and will see the full outcome of experiment.
To keep the temperature the same I will do the experiment in a water bath. If the temperature is hotter in one experiment than another then the one that is hotter will have an increased amount of kinetic energy meaning the substrate and enzyme will have a bigger chance of colliding. If the temperature is to hot it will denature the enzyme so I must make sure the temperature I do the experiment at is not to hot. I will do my experiment at 25oC as I know this will not denature either as it is less than the temperature of the body so the pigs liver catalase will be fine and yeast is still fine at that temperature so the yeast catalase will not have denatured.
The pH of the solution is also important to keep constant as if the pH is too high the enzyme will denature and if it is too low it will not work as fast. I would like to get this experiment done at the optimum pH of the catalase (the most effective pH) to achieve this I will use a 7.4pH buffer. It will be 7.4pH as that is the pH of blood and a lot of catalase is found in the blood. This will be ok with the yeast as it is just slightly over pH of water and yeast is ok at pHs around there.
The concentration on hydrogen peroxide is important to keep the same. The higher the substrate concentration the faster it reacts as there is more substrate to react with the enzyme. To keep this the same I will use a constant concentration of hydrogen peroxide and a constant volume. The most suitable concentration will be found in a pilot experiment.
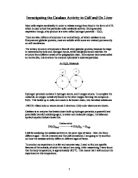
It is the same with enzyme concentration. I will start with 3.5g of liver or yeast per 50cm3 of water and mix the homogenised tissue with sodium alginate to form beads in a 2:1 ratio. The more catalase there is the more hydrogen peroxide it will be able to be reacted at once to control this variable I will have to keep the beads all the same size by measuring them. I will choose beads with a 5mm diameter. I will measure each bead with a ruler to make sure it is right.
Pilot Experiment
To complete my experiment I must find out a reasonable strength of hydrogen peroxide to use. If it is to strong my catalase beads will float as soon as they are dropped in to the hydrogen peroxide. But if the concentration is to weak the beads will take to long to reach the surface. I would like the beads to reach the bottom of the beaker and start to rise again soon after that. I will do this using both yeast catalase and pigs liver catalase in case what works well with one doesn’t work well with the other one. The first thing I will do is make the beads. I will liquidize 3.5g of liver with 50cm3of water and 2cm3 of pH buffer. I will make sure there are no lumps left in the solution. I will then make the beads by mixing 20cm3 of liver solution with 10cm3 of sodium alginate. I will then make small balls of this by syringing it in drops to a beaker of calcium chloride which will make it set hard. I will then wash the beads off in water to get the calcium chloride off. I will use the same process and measurements for the yeast beads of mixing yeast with sodium alginate and dropping it in to calcium chloride. I will then drop the beads of the two substances in to different concentrations of hydrogen peroxide and see which gives me the desired affect.
Table 1: The effect of changing hydrogen peroxide concentrations on the time taken for immobilised yeast and pigs liver catalase beads take to rise in hydrogen peroxide
From these results I chose to use 0.05 mol.dm-3 Hydrogen Peroxide. I feel this gave me a good time for 0 mol.dm-3 of ethanol It reached the bottom of the test tube and stay for a bit before coming back up which will allow me to time it accurately. It didn’t take too long though as I was using no ethanol yet and the addition of ethanol will slow down the reaction so I don’t want it to take a long time with no ethanol as I will have to wait a long time once I start adding high concentrations of ethanol.
Final Method
1. Make Beads
I will use the same method to make the beads as in my pilot experiment. For the liver ones I will liquidize 3.5g of liver with 50cm3of water and 2cm3 of pH buffer. I will keep liquidizing it until there are no lumps left in the solution. I will then make the beads by mixing 20cm3 of liver solution with 10cm3 of sodium alginate. I will then make small balls of this by syringing it in drops to a beaker of calcium chloride which will make it set hard. I will then wash the beads off in water to get the calcium chloride off. I will use the same process for the yeast beads I will mix 20cm3 yeast solution with 10 cm3 sodium alginate and dropping it through a syringe into a beaker of calcium chloride.
If any beads floated in the calcium chloride I discarded them as it already meant they had air inside
2. Make Hydrogen Peroxide and Ethanol solutions
I will make up one concentration of 0.05 mol.dm-3 hydrogen peroxide by mixing together 5cm3 of hydrogen peroxide with 95cm3 of distilled water. I will use this to make up my hydrogen peroxide/ethanol solution.
I will mix these up with the amounts shown in the table below
Table 2: The production of a range of ethanol concentrations
I will make 2 test tubes of each solution 1 for the liver catalase and one for the yeast catalase. I will make the solution at the same time so that they were exactly the same concentrations. I will label each test tube so I know what it is.
3. Dropping the beads in
I was now ready to start the experiment. I started at the 0.00 concentration of ethanol. I would take one bead about the 5mm size and would drop that into the hydrogen peroxide/ethanol solution. I started timing as soon as the bead broke the surface so I timed its decent to the bottom and then back up. I stopped the stop watch as soon as the bead reached the top of the solution. I then removed the bead using tweezers would remove the bead to stop it catalasing the solution. If the bead didn’t reach the bottom I discarded it and started again. I would then do the same in the yeast test tube with a yeast bead I would repeat this 3 times with both different catalases. I then moved on to the next concentration. I would right down my results to the nearest second as the apparatus I had would not allow for more accuracy than that.
I decided to repeat the experiment three times over to collect a lot of results. This would help me to identify any anomalies and also to calculate a mean to help me spot any trends in the data.
Results
Table 3: table to show the effect of increasing ethanol concentrations on the time taken for an immobilised pig liver catalase bead to rise in hydrogen peroxide
Table 4: table to show the effect of increasing ethanol concentrations on the time taken for an immobilised yeast catalase bead to rise in hydrogen peroxide
Table 5: table to show the inhibition of pig liver catalase and yeast catalase by ethanol (difference between the average time taken for the bead to rise in each concentration and the time taken in the 0.0mol.dm-3 ethanol)
Table 6: to show the effect of ethanol on the mean rate of reaction (the difference between the mean rate of reaction at each conc and the mean rate of reaction in the 0.0mol.dm-3 )
Analysis
Trends
From my results, and the graph that I have plotted and the five tables you can see that the more ethanol there was the longer it took for the bead to return to the surface which means that increasing the ethanol concentration decreases the rate that catalase works at. This was clearly true for both types of catalase. What the processed data shows though is that there wasn’t a massive gap between the effects of the ethanol on the yeast and the pigs liver catalase. In the processed data you can see that the pigs liver gets inhibited a lot more effectively than the yeast catalase which supports my hypothesis.
The pigs liver catalase starts off with almost double the rate of reaction of the yeast catalase but by the end there is only 0.0003 in it. I think at about 0.05mol.dm-3 ethanol concentration the catalase starts to get denatured very effectively as there is a steep rise in the time taken for both catalases up to there. By 0.6mol.dm-3 I think the ethanol has denatured nearly all of the catalase. The two catalases get quite close together I think there is not much more the ethanol can inhibit in either of them so they take about the same amount of time. I think if I carried on doing the experiment it would take a very long time to get any data after this point as basically all the catalase will be denatured in both tissues and so the bead would not rise at all. As you can see from the graph the yeast catalase slows down its rate of denaturing between 0.02mol.dm-3 and 0.04mol.dm-3 of ethanol solution. I don’t know why this is. It may be something to do with ethanol struggling to find catalase which has not already been denatured in the beads until there was a bit more ethanol to find more but I don’t think it is as this didn’t happen in the liver catalase which stayed steady until 0.04mol.dm-3 when they both slowed down a lot. I know that catalase is a non competitive inhibitor from my research before.
Non competitive inhibitors do not bind with the active site but at some other pointon the enzyme. It is this binding that causes changes to the overall tertiary structure of the enzyme and therefore indirectly changes the shape of the active site. The normal substrate, catalase, would no longer fit into the active site and so the reaction would slow down as more and more active sites are altered. Obviously the greater the concentration of the ethanol the more the active sites are likely to be denatured because there will be increased chances of collisions occurring randomly between the catalase molecules and the inhibitor.
Anomalous Results
I had one anomaly in my data which I highlighted in my table 4 I removed this to process it as if I had used them they would have made my mean rates unreliable. I think I did quite well to stop any anomalies with my variable controls but I still got this one. I don’t know exactly why I have this anomaly but I have got a few theories. I could have got it because of any of my variable controls not working correctly. I may have measured out the solutions wrong or the temperature in the water bath my have changed. Another theory I have is that the amount of liver or yeast catalase in that bead my have been higher or lower than all the rest as either it didn’t get stirred correctly or it just ended up like this. I think this is quite a big possibility for the really quick pigs liver result that I got. My last idea and probably most likely is that not all the air bubbles stay at the side of the bead and pushed it up. They may have floated up on the own. If a lot of them did this on the same bead it would make it take a lot longer This is what I feel happened on the yeast one that took 119 seconds. I have a way to stop this but I will talk about that later.
Evaluation
Reliability
I think my reliability of my data was quite good as you can see from the range of repeats at each concentration. They are all in very tight around the mean result. I think I could have done more repeats of the same concentrations maybe 6 for each one as this would give me a better mean and should reduce errors caused by a number of anomalies.
The main variable that could have made a small differences like I have in my error bounds is the bead size. I think it would be very hard work to get your beads all exactly the same. I think you would have to measure out and make all your beads individually which would take a very long time I don’t think you can really control them better than just measuring them with the time scale I had. I think I would have liked to time it to 0.1 of a second if I did it again as this would again make my results more accurate.
Limitation in the method
I think I could have made my experiment a lot more reliable. The first and main thing I think I could have made more reliable would be my method of measuring the volume of oxygen given off. I think it would be better to measure the oxygen directly instead of measuring how long it took the oxygen to bring the bead to the surface. This is because some beads may have a lot of bubbles just float to the surface on there own or others may have lots of bubbles stay round it really quickly which would make it rise quicker than normal. One way that you can measure the volume of oxygen gas given off accurately is to use a gas syringe and just mix the catalase, ethanol and hydrogen peroxide together without actually putting the enzymes into a bead.
Also as I said above the bead size could be controlled better but I can’t think of a better way to do it than measuring with the time scale I had.
Another thing I think could have affected my results was using the same solution for each trial of the same concentrations by the time the third one went the hydrogen peroxide had already being broken down by two other beads meaning that by the time it got in there was less hydrogen peroxide to break down so less oxygen to get hold of so that it can float back up. It doesn’t appear to have been a huge factor because otherwise the three repeats would have taken longer each time and this was not the case but it would be better to control this.
I would like to try a bit more varied concentrations of ethanol. Maybe go a bit higher to see if it does denature all the catalase before it rises or go to 0.005 mol.dm-3 concentrations. This may help me to see why there was that flat patch in the yeast results.
Improvements
If I was to do this experiment again there are a few things I would change to get my accurate and reliable results. I would try timing it to 0.1 of a second instead of just to 1 second This would make my results more accurate and give me a better picture of the inhibiting. I would also like to measure the concentrations out to 0.005 mol.dm-3 This would make the more accurate timing useful and would allow me to see a better and more accurate graph.
I would also like to try and come up with a way of measuring the size of the beads better I could maybe do it by mass instead of size but then the ones with a bigger surface area would rise quicker instead of the lighter ones, so I’m not sure how I would do that.
The main change I would make to my experiment is using a gas syringe this would sort out my problem of having bubbles not carry the bead up. I would have a certain time limit and count how much gas it makes in that time. You are then though have a problem of when it rises to the surface not all of it is touching the solution so it would reduce its own surface area. So you have to find a way of keeping it under.
I would also like to use fresh hydrogen peroxide solutions for every try. As this would solve the problem of the solution diluting itself as I do more repeats.
Another thing I would change is do more repeats of each concentration I would probably do 6 repeats for each one which would take longer but would be worth it. It should make it easier to work out which results are anomalies.
Conclusion
My results don’t give enough evidence to accept the hypothesis. In fact, they show that there is not really any much difference in the degree of total inhibition at the strongest concentration of ethanol. I would need to use a statistical test such as the Mann Whitney u test to work out if the difference between the inhibition of the two yeasts is significant.