Data treatment
Once I have the results for the object and image distances the first thing I will do is find the average image distance for each object distance in both of the filters. Once I have done this I will find the reciprocal values of the image and object distances for both of the filters.
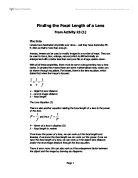
I will be using the equation
1/U + 1/V = 1/F
I have worked out that this can be rearranged into the equation for a straight line (y=mx +c) with a gradient of minus one and a constant of 1/f
1/U = -1(1/V) + 1/F
Using this equation I can plot the respective reciprocal values of the object and image distances onto a graph showing 1/U against 1/V. This straight line can be extended so that the point where the line intercepts the y axis is found. And at this point the x value is zero meaning 1/U=1/F so the intercept of the y axis finds the reciprocal of the focal length of the lens. I will plot the graph for both the blue and red filters and compare their focal lengths. The graph will look like the one below
1/U
1/V
Then using sound physics I shall explain the graphs and draw a conclusion from them.
Due attention and consideration to accuracy and sensitivity
When setting up my apparatus I will make sure that everything is exactly in line. This means my screen, lens, image and light source will all have to be as close to parallel to each other as possible. If they are not in line then my image and object distances will not be accurate because the light hasn’t travelled in a direct straight line from the light source through the image and lens onto the screen, and my meter rule or tape measurer will be measuring these distances as if they were straight. If they are all in line then the image should be projected onto the screen without having to move the screen (I may have to put the ray box or screen on top of a book to ensure this).
I have worked out appropriate object distances so that when I am plotting my graph the points are evenly spaced. This means that I will be able to see the correlation of the points on my graph more easily.
I will also keep everything as constant as possible by; using the same ray box, using the same voltage to the ray box, using the same screen, keeping the screen tilted perfectly in line with the other apparatus all the time, and obtaining all of my results in the same level of light. The only variable will be object distances and the type o filter.
I will be doing repeats so that my results become more reliable, and therefore ensure a more accurate conclusion and a higher likelihood of success in completing my aim.
I will be using a meter rule which can measure distances to the closest millimetre. The meter rule is the most accurate measuring device I could get for measuring distances ranging from 200cm-20cm. This will keep the errors in my experiment low allowing a more reliable conclusion
Safety
I will be carrying out the experiment in the dark so I will be careful not to walk into other people and objects because this could lead to an injury.
The ray box will be on for a long period of time and may get very hot so I will let it cool down before touching it (to put it away) so that I do not hurt my hand. I will also make other people aware of this so that they don’t burn their hands.
Results tables
There are no anomalies in my results
Analysing the graph
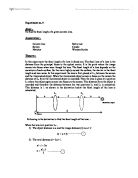
The lines on my graphs both have gradients of around -1 and are parallel to each other. This shows that the only variable could have been the colour of the light. The gradient was minus one because of the equation of the straight line I was using (1/U = -1(1/V) +1/F) had a theoretical gradient of minus one.
The graph shows that the blue light has a shorter focal length because the blue line is above the red line meaning the reciprocal value of the focal length is greater. Using the graph I worked out that the blue light focal length was 0.187 meters and the red light focal length that was 0.192 meters (I did this by finding the y axis intercept). This is because the blue light has a shorter wavelength compared to the red light and travels at the same speed as the red light so the blue light must have a greater frequency. Because the blue light has a greater frequency it travels a greater distance inside the lens and this means the lens to bends the light more because the blue light is affected by the different density of the glass more than the red light.
Conclusion stated and related to results
The focal point of a lens changes as the colour of light changes. This is shown in my results because the blue light (which has a longer wavelength than the red light) always had a smaller average focal point for each respective object distance compared to the red light. For example when U was 22cm the average focal point for blue light was 152.8cm and for red light the focal point was 158.5cm. In conclusion the colours of light with smaller wavelengths like blue light bend more than light with longer wavelengths like red light
Quantitative and qualitative discussion of limitations, errors and conclusion
In the experiment there were many errors that could eventually be magnified making inaccurate results. These were the range of the focal point because I could not find the specific focal point with my eye, measuring the meter rule or tape measurer, estimating where the lens was because the lens holder obscured the vision of the meter rule. These percentage errors can be worked out using the equation percentage error = (error x 100)/reading. To find out the largest amount these could have affected my results I will find the percentage error for the longest length measured, which was when I was measuring using the object distance of 20cm with a red filter. The also for a blue filter and compare to find any overlap
Red filter for U 20cm
Blue filter for U 20cm
Calculations
For red light
0.25 + 0.02 + 11.14 = 11.41
Using 1/U + 1/V = 1/V the focal length is 0.192 meters
Largest possible focal length = 0.192 x 1.1141 = 0.214(m)
Smallest possible focal length = 0.192 x 0.8859 = 0.170(m)
For blue light
0.25 + 0.02 + 10.21 = 10.48
Using 1/U + 1/V = 1/V the focal length is 0.183 meters
Largest possible focal length = 0.183 x 1.1048 = 0.202(m)
Smallest possible focal length = 0.183 x 0.8952 = 0.164(m)
From these values I can see that the focal lengths of the red and blue light do overlap, in that the blue lights highest focal length (0.202(m)) is greater than red’s smallest (0.170(m)). After seeing the extent at which they overlap I would say that my errors are so big because of the limitations that my results have limited reliability and therefore my conclusion has limited reliability. However the trends and patterns were still present. These percentage errors were chosen because they are the largest possible error in my experiment. In conclusion I have the experiment was successful because the aim was achieved. The focal length of a lens is inversely proportional to the frequency of the light travelling through the lens.
I think that I did enough repeats to make my results reliable enough for it to make my conclusion more accurate. I also found no anomalies in my results that could affect the way in which the results manifest themselves on a graph this would make my conclusion harder to make and less reliable. However in the experiment I choose the two most extreme wavelengths in the visible light spectrum. I can only presume that the rest of the wavelengths in between behave the same way. This limits the reliability of my conclusion.
My aim was achieved but the conclusion is not very reliable.
Modifications
To make my results more accurate I could use auto focus technology that can be found in some projectors and cameras rather than the human eye (which has questionable reliability) to determine the focal point. This will ensure that I have the smallest possible error in the perception of the best (most in focus) image distance. And in my experiment I found the percentage error in the determining of the focal point to be over 10%. Without this error my conclusion would still have been the same. I could also use a see through lens holder because it was hard to determine the object distance using the lens holder provided, and because I was using reciprocal values a small difference is magnified when dealing with small object distances. I would also measure more distances to increase the reliability. I would also use different lenses so that I could compare that affect to gain a more reliable conclusion. And I would also a transparent lens holder designed to slide over a meter rule to increase he accuracy of my results.