Another reason for the significant differences between the light exposed area and the light shaded area, maybe due to photosynthesis. Leaves contain chlorophyll, which exposed to light causes photosynthesis. This is done via the light dependant stage where the chlorophyll is excited by sunlight and releases an electron which does down the electron transport chain and synthesis ATP; this is used for growth and other processes. Due to the leaves being in a shaded area there is not enough light, so to counter this by increasing there surface area. This causes there to be more chlorophyll and there to be a bigger surface area to catch sunlight and increase evaporation. As for the leaves in the light exposed area they don’t need to increase there surface area, as there is enough light as photosynthesis is already taking place at maximum effectiveness. Also the surface area is decreased to decrease the evaporation of water.
However in my results there were many anomalies all of which I have outlined in my summary table above. These results could have affected my overall means. Also the soil with greater nitrate content (Light Exposed Area) had smaller leaves; this should not be true as nitrates are used for DNA, protein and amino acid production, therefore the leaves should be bigger for the soil with greater nitrate content. Reasons for the anomalies and any possible errors in recording nitrate levels will be further evaluated in the evaluation.
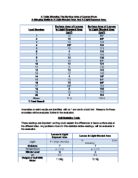
Statistical T-Test & Hypothesis Testing
To find the difference between the two readings, I will perform the T-Test then choose a null hypothesis or my original hypothesis. The T-Test will show me how big the difference is between my two readings.
Here is my working out for the T-Test:-
The T-Test has given the figure 13.48; this figure is above all the probabilities below. Therefore I have come to the conclusion that my primary hypothesis was correct, that “There is a difference in surface area between leaves within a shaded area compared to a light exposed area”. These results also prove my null hypothesis wrong. Any problems which I have faced in my investigation or any sort of limitations I may have face in my method, equipment or measurements will be evaluated in my evaluation.
Evaluation
In my investigation I faced many problems and limitations due to my method, equipment and measurements. One problem which I faced was the anomalies in my results. These could of been to many reasons but I came to the conclusion that some of my leaves specifically the ones showing the anomalies had areas of the leaves taken away or had perforations. This could have been due to insects or the handling of the leaves, as the leaves may have rot over the 24/48 hours taken to process the measurements. Further to this problem is the use of 1cm grid square to measure the surface area, this is not an accurate enough measurement of the leaves. As areas of the leaf which did not cover the 1cm square over 50% were not recorded so this would have given an inaccurate reading. As a result the anomalies in my table would have affected my overall mean, therefore affecting my T-Test result. I believe the use of a 1cm grid square and the presence of perforated leaves led to anomalies in my results. To counter these problems I could have used a more accurate method to measure the leaves surface area, such as using a computer scanner and software to measure the leaves surface area. This would account for the leaves irregular shape and any perforations in the leaf. Also when picking the leaves I could have picked leaves without perforations and could have processed the measurements of the leaves within 24 hours. I believe this to be a major factor which impacted my results.
A problem I faced problems with my equipment during the nitrate test. This involved me diluting the soil in water, and then using a nitrate indicator stick to find out what the nitrate level was. Problems appeared when I compared my colour to the guide on the back of the packaging, where the comparisons of the colours were opinionated so not totally accurate. Also the colour scale was in groups, for example one colour could account for a nitrate level from 10 to 10.5. So if two soil samples had the same colour in the nitrate test, it doesn’t mean the soil samples have the same nitrate level. Overall I don’t believe this factor affected my results by much, but did cause confusion in the analysis. As it would be assumed higher nitrate level leads to bigger plants including the leaves, which is not true in this case. To avoid such confusion in the future I will use an electronic nitrate reader which will reduce any human error and provide more accurate results. I believe this to be a minor factor which impacted my results.
Another problem was the weather and the sunlight. The weather on the day which we collected the results may not be representative of the weather on a normal day. This would affect my soil statistic readings and may have cause problems in my analysis where the results depended on there being shade or light. Also when measuring the light there were problems with the angle at which the light probe was facing, for example if you face the probe towards the sun the reading will be higher and if you face it away from the sun the reading will be lower. Also the sun is continuously moving throughout the day so it was very hard to keep track of the light. These results could have affected my overall conclusion and could have invalidated my measurements of the leaves, as the leaves which I measured may not have been continuously in the shade or continuously in the sun. I could counter these effects next time by recording all the soil statistics everyday at certain time, five days before picking the leaves. These would give an average light, nitrate, moisture, water weight and temperature reading. As on the day it had rained the night before and this may have affected my results, my new plan would counter this as there would be a mean moisture reading. Also to counter the light reading I could have a used a light probe with a large surface area, or recorded the light intensity in different places in each area, therefore giving me a better average light intensity reading. Overall I believe the equipment used was outdated and was not up to task at hand. Next time I may do a test run with new equipment and if I face any problems. I could counter them by changing my method for the actual investigation which would reduce any chance of error. I believe this to be a major factor which impacted my results.
In conclusion I believe I have proven my hypothesis that “There is a difference in surface area between leaves within a shaded area compared to a light exposed area” even with my method and apparatus being seriously flawed. Even if my method and apparatus were to be flawless I believe my conclusion would still be the same. As there was obvious face validity and by just looking at the two sites you can tell that there was a difference. I believe the sample I collected was enough to prove my hypothesis correct as leaves were collected randomly from the area of choice. I could have further improved the validity of my results by repeating this investigation up to three times.