In this experiment, a buffer solution is used. A buffer solution is an aqueous solution consisting of a mixture of a weak acid and its conjugate base or a weak base and its conjugate acid. It has the property that the pH of the solution changes very
(443 words)
little when a small amount of acid or base is added to it. Buffer solutions are used as a way of maintaining pH at a nearly constant value in a wide variety of chemical applications. As mentioned above, the pH of the environment of catalase can affect the enzymatic rate of reaction. Therefore a buffer solution is used to maintain the pH of the environment of catalase at a nearly constant so that the enzymatic rate of reaction does not affect by the pH of the environment of catalase. The buffer solution used in this experiment is buffer solution of pH 6.5.
In this experiment, the oxygen gas evolved from the reaction will be transfered through the delivery glass tube to the measuring cylinder. The time is taken at intervals of 30 seconds for the oxygen gas evolved to move to the measuring cylinder. For every set of experiment, different amount of catalase is used. The amount of catalase is manipulated by adding different amount of blended potato using spatula. Then the graphs of the volume of oxygen gas evolved are plotted against the time taken at intervals of 30 seconds for different enzyme concentration. From these graphs, the initial rate of reaction is calculated by finding the gradient of the graphs. Then a graph of initial rate of reaction against enzyme concentration is plotted.
Problem Statement:
What is the effect of concentration of enzyme on the rate of reaction?
Hypothesis:
There is a correlation between enzyme concentration and the rate of enzymatic reaction. When the concentration of enzymes increases, the rate of reaction increases. In this experiment, when the concentration of catalase increases, the rate of decomposition of hydrogen peroxide increases.
Aim:
The aim of this experiment is to investigate the effect of enzyme concentration on the rate of reaction
List of Materials and Apparatus:
The materials and apparatus needed for this experiment are potato, buffer
solution of pH 6.5, hydrogen peroxide, distilled water, test tubes, stopper, glass tube, stopwatch, beaker, measuring cylinder, dropper, syringe, blender, spatula, test-tube-rack, labels and knife.
Variables:
1. Manipulated variable: Quantity of potato extract used
1.1) Manipulating the variable: Adding different number of spatula of blended potato (from 1 spatula to 5 spatulas) to 5 test tubes labeled from 1-5.
2. Dependant variable: Rate of gas evolution
2.2) Recording the variable: For every 30 seconds, the volume of gas in the measuring cylinder is read and recorded.
3. Constant variable: Volume of buffer solution, volume of hydrogen peroxide,
concentration of hydrogen peroxide, temperature of the
environment of catalase, time taken to record the volume of
gas in the measuring cylinder
(436words)
3.3) Controlling the variable: 10 cm3 of buffer solution of pH 6.5 is added to all the test tubes containing different amount of blended potato. 2.5 cm3 of hydrogen peroxide of the same concentration (from the same bottle) is added to all the test tubes containing different amount of blended potato. Throughout the experiment, the experiment is conducted in an air-conditioned room of temperature 26oC. Every subsequent reading of the volume of gas in the measuring cylinder is read and recorded for every 30 seconds.
Technique:
In this experiment, two techniques are applied to conduct the experiment. The two techniques are as follow:
1. To measure volume of gas evolved at specific time intervals for a given period of
time.
2. Gas is collected by downward displacement of water.
Precautionary Steps:
Before handling the experiment, the safety precautions must be prioritized. The precautionary steps that should be taken in this experiment are as follow:
- During the experiment, lab coat should be worn to prevent chemicals from spoiling clothes.
- Care should be taken when handling hydrogen peroxide solution as it is irritant and may bleach object in contact with it including skin.
- Eye protection/goggles and gloves should be worn to protect the eyes and skin.
- Hydrogen peroxide contained in a bottle was closed when not using to avoid it from decomposing and contaminated.
- Fresh blended potato is used instead of potato cubes or potato discs.
The steps mentioned above are the precautionary steps to be taken. Otherwise, good laboratory practice is sufficient to take account of any hazards and avoid significant risks.
Risk Factors:
There are some risk factors in this experiment. They are as follow:
- Hydrogen peroxide irritant
- Tube breakages
The risk of mentioned above can be minimised by handling the materials and apparatus with extra care.
Procedure:
Five different concentrations of blended potato are used to test whether the increase in the enzyme concentration affects the rate of enzymatic reaction (oxygen gas evolved from hydrogen peroxide solution).
- The apparatus is set up as show in Figure 1
(346 words)
- Firstly, a beaker was filled with three quarter of water.
- Then, a potato was cut into pieces and blended in the blender.
- One spatula of blended potato was added into a test tube.
-
Next, 10 cm3 of buffer solution was measured using a dropper and a measuring cylinder and added to the test tube.
- The test tube was swirled gently so that the blended potato and the buffer solution mixed well.
- After that, the test tube was place in a test tube rack.
- Next, a measuring cylinder was filled with water and inverted carefully into the beaker filled with water so that water would not spilt out from the measuring cylinder.
- 2.5cm³ of hydrogen peroxide solution was measured using a syringe.
- Then, the hydrogen peroxide solution was transferred to the test tube.
- Immediately the test tube was stoppered by a stopper with delivery glass tube connected to the measuring cylinder.
- The test tube was shaken gently throughout the experiment to ensure the mixture in the test tube mixed well.
- The volume of oxygen gas evolved in the measuring cylinder was measured every 30 seconds for 4 minutes.
- Steps 2 to 13 were repeated by using 2, 3, 4 and 5 spatulas of blended potato.
- After that, all the measurements were recorded in a table.
- Graphs of different catalase concentrations were plotted against time in the same graph paper.
- The initial rate of reactions for different catalase concentrations were calculated by finding the gradient of the graphs.
- Finally, a graph of initial rate of reaction against enzyme concentration was plotted.
(280 words)
Observation:
Tables:
Table 1 shows the different amount of potato extract used and its corresponding amount of buffer solution and hydrogen peroxide solution used.
Table 2 shows the volume (cm³) of oxygen gas released every 30 seconds for 4 minutes for different quantity of potato extract used.
(163 words)
Table 3 shows the concentrations of enzyme and their corresponding initial rate of reaction.
Graphs:
Six graphs are plotted. Graphs 1 to 5 (plotted in the same graph paper) are graphs of volume of gas evolved against time with different quantity of blended potato/potato extract used(concentration of catalase). Graph 6 is graph of concentration of enzyme catalase against initial rate of reaction.
(83 words)
Discussion:
- In the experiment, besides concentration of catalase, the other factors that could affect the rate of reaction were time taken to record the volume of gas in the measuring cylinder, pH (pH6.5), temperature of the environment of catalase, concentration and volume of hydrogen peroxide used
- Under the condition of all of these factors were kept constant as possible, the rate of reaction became higher as the concentration of catalase (blended potato/potato extract) was increased. This was because more active sites were available to bind with hydrogen peroxide at the same given time. Hence, there was more collision between the substrate and enzyme active site. This results in a higher number of effective collision, therefore the reaction occured more rapidly in the same given time. In other words, when the concentration of enzyme was higher, there were more active sites available for enzymatic action. The rate of enzymatic action would be higher as more enzyme-substrate complexes were formed in a given time and more products are produced in a given time.
- By drawing a tangent on the steepest part of the graph of volume(cm³) of oxygen gas evolved against time taken(s) and calculating the gradient for every experiment with different concentration of catalase (blended potato/potato extract), the initial rate of reaction was determined. This method was used for it is more accurate than the method of dividing the total volume of oxygen gas liberated by total time. This was because initial rate was measured right at the start of the reaction at which other factors like temperature have not had time to change and affect the rate of reaction.
-
For graph 1 to graph 5, volume of oxygen gas evolved in cm3 was plotted against time taken in second.
- All the graphs showed similar shape. However, the higher the concentration of catalase, the higher the graph in the graph paper relative to graph produced by lower concentration of catalase.
- From the calculated gradient, it could be seen that the value of the gradient increased for each subsequent increment in catalase concentration. This indicated that even though the shape for each graph was more less the same, the value of the gradient was still different as according to value.
- Instead of just plotting one graph in one graph paper, all 5 graphs of different concentration were plotted in the same graph paper. By doing so, the different patterns of enzymatic reaction for every decomposition reaction of hydrogen peroxide could be seen and differentiated clearly. Generally, this graph paper showed a general trend of increasing volume of oxygen gas evolved collected in measuring cylinder per unit time. The graph with more enzyme concentration had higher reading for volume of oxygen in a given time. This indicated that more enzymes were actually present as the amount of blended potato/potato extract was added to speed up the decomposition reaction.
- This graph paper also showed that the graphs of 3, 4 and 5 scoops of blended potato/potato extract were relatively close to each other, while the graphs of 1 and 2 scoops of blended potato/potato extract were relatively close to each other but relatively far from the graphs of 3, 4 and 5 scoops of blended potato/potato extract. This indicated that there was a great gap between the volume of oxygen gas evolved of 2 scoops of blended potato/potato extract and 3 scoops of blended potato/potato extract at any given time. This happened due to fact that when the experiments for 1 and 2 scoops of blended potato/potato extract were about to be conducted, the blended potato/potato extract prepare remaining was very little. Not full scoop of blended potato/potato extract was taken, thus reducing amount of blended potato/potato extract that suppose to be in experiment of 1 and 2 scoops of blended potato/potato extract.
-
Graph 6 showed the rate of reaction for different enzyme concentration. This graph was obtained by plotting the initial rate of reaction measured in cm³s-1 against catalase concentration(number of scoops of blended potato/potato extract) in arbitary unit. In this graph, it can be seen that concentration of catalase increased linearly with initial rate of reaction. This means that an increase in the concentration of enzyme would increase the rate of reaction.
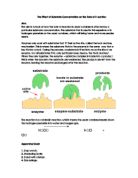
- The shape and the pattern of the graph had proved that the hypothesis was correct. The increase in catalase concentration would increase the rate of decomposition of hydrogen peroxide. It should be noted that catalase did not react with hydrogen peroxide during the reaction, it just speeded up or catalysed the decomposition of hydrogen peroxide. Higher concentration of catalase provided more binding site for hydrogen peroxide to bind with catalase, thus more hydrogen peroxide molecules could be catalysed and the rate of reaction was increased. The increase in the amount of blended potato/potato extract (concentration of catalase) increased the volume of oxygen gas released over a unit time.
- In the experiment, fresh blended potato was used instead of potato cubes or potato discs. Blended potato was used as it was more practical and was able to produce a more accurate reading. This is because blended potato had a uniform concentration throughout the suspension and it provided larger total surface area for the enzyme which would accelerate the decomposition of hydrogen peroxide. The time taken to complete the experiment would be longer if the blended potato was not used,
- There were a few unavoidable limitations in this experiment which may affect the accuracy of the results. The following were the limitations and their respective improvements:
- One of them was systematic error. It should be noted that there was a time lag when starting and stopping the stop watch. This time lag was referred to as human reaction time, usually ranged from 0.1 to 0.2 seconds. However, this error would not affect the consistency of the results as all the readings were affected by this error. This limitation was unavoidable as all everybody had a reaction time. However, a more skillful observer (with faster reaction time) could improve this limitation.
- Besides that, in the experiment, oxygen may escape to the surroundings when hydrogen peroxide was mixed and reacting with blended potato before the test tube was closed with stopper which was connected to delivery tube and measuring cylinder.
- Also, oxygen gas evolved from the decomposition of hydrogen peroxide may stuck in the delivering tube, resulting in the readings taken to be inaccurate. Consequently, the reading was less than what it supposed to be at a particular instant. This could be improved by using rubber delivering tube instead of glass delivering tube. Rubber delivering tube is flexible and can prevent air bubbles from being trapped inside by shaking and squeezing it a bit and moving it left and right throughout the reaction. It also solve the problem of possible breakage of delivery tube in the experiment.
-
The measuring cylinder used in the experiment was not sensitive enough to detect small increase in the volume of oxygen gas evolved. This could be improved by using a burette as it was more sensitive than measuring cylinder. Using burette in the experiment also provided another benefit. As the burette can contain a relatively high volume of fluid, the changing of gas collector due to inadequate volume in the experiment could be avoided.
- Another limitation that may occur in the experiment was the dissolve of oxygen gas into water. Oxygen gas could dissolve slightly in water. Thus in this experiment, some of the oxygen gas evolved from the reaction had slightly dissolved the in water when moving to the measuring tube. However, this only give a small effect to the result as oxygen will only slightly dissolve in water. To improve on this, the water could be saturated first with oxygen before collecting the gas in the measuring cylinder.
- In addition, the beaker used in the experiment was not big enough. As a result, the measuring cylinder had to be slanted a bit due to the limited space the beaker provided. The slanted measuring cylinder may cause taking the reading more difficult. Parallax error may more likely to occur. To improve on this, a bigger beaker or basin should be used so that the measuring cylinder was in up stand position. Besides, the water used can be dye with colour to make it easier to read the measuring cylinder.
- The other limitation in this experiment was when measuring the volume of hydrogen peroxide, syringe was used instead of pipette. Syringe had lower sensitivity as compared to pipette. Hence the concentration of the substrate may have change a little. Enzyme concentration in this experiment was measured in arbitrary unit. This concentration is represented by the amount of blended potato/potato extract taken using spatulas. This means increment in enzyme concentration is just made by adding up the number of spatulas. This was not an accurate way to measure the concentration of the enzyme. To improve this, the blended potato should be prepared in 1 molar solution and then been diluted to create different concentrations. Besides that, when blended potato is being transferred from spatula to test tube, some of the potato stuck at the of the spatula. This may affect the rate of reaction because less blended potato was added into the test tube thus the test tube contained less catalase to speed up the decomposition of hydrogen peroxide.
- It would also have been better to have repeated the experiment for each concentration more times to make the results more reliable and so it could be sure that the results were not obtained by chance. This may have eliminated anomaly in the results.
- Comparison of the results in this experiment was made with results of others groups of students who also conducted the experiment. The results were approximately similar to each other. All the data that obtained from the experiment had the same pattern although there were some differences.
- There were no apparent anomaly in the results and none of the sources of error or limitations of the experiment were sufficient to cause the results unreliable. However, the sources of error and limitations in the results may have made the results slightly less accurate.
-
Further investigation could be conducted if there were more time given to investigate the rate of decomposition of hydrogen peroxide. It could be investigated how temperature, pH and substrate concentration (concentration of hydrogen peroxide) influenced the rate of decomposition of hydrogen peroxide.
Conclusion:
An increase in the concentration of enzyme can result in the rate of enzymatic reaction to be higher as there are more active sites provided by the enzymes for the substrate molecules to bind and form more products, given that the substrate molecules are in excess. Hence, the higher the amount or concentration of blended potato, the higher the rate of reaction between the blended potato and hydrogen peroxide at which the volume of oxygen gas evolved at a given time increases as the concentration of blended potato is increased.
References:
- Edexcel AS Biology, students book, Pearson company, 2008
- Edexcel Biology for AS, CJ Clegg, Hodder Education, 2008
- Text PRE – U Biology Volume 1, Lee Ching, PEARSON Longman, 2008
- International Edition Biology Seventh Edition, Campbell, Reece, Pearson Benjamin Cummings, 2005
(143 words)