Results:
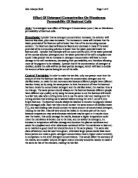
Table of Absorbance values measured at increasing Detergent concentrations:
Table of Colorimeter values measured at increasing Detergent concentrations:
Analysis: After collecting and correlating the results, I have come to the conclusion that the experimental hypothesis is correct in that an increase in temperature and concentration will damage and denature the plasma membrane and cause the cytoplasm and other substances contained within the membrane to leak out. This has been shown by a steady increase in Anthon cyanine leaked out of plant cells as the concentration and temperature increases.
The purpose of a cell membrane is to control the transport of substances moving into and out of a cell. The membrane is an extremely thin layer (8 to 10 nanometers (nm)) thick, which is partially permeable. It consists mostly of lipids and proteins. The lipids found in cell membranes belong to a class known as triglycerides, so called because they have one molecule of glycerol chemically linked to three molecules of fatty acids. The majority belong to one subgroup of triglycerides known as phospholipids.
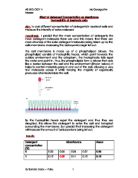
The cell membrane is made up of a phospholipid bilayer. The hydrophobic tails of the detergent molecules are taken up by this bilayer. The detergent's hydrophilic heads will then repel (Micelle, an electrically charge particle built up from polymer molecules or ions and occurring in certain colloidal electrolytic solutions like soaps and detergents) the individual phospholipids and this will mean they are 'disrupted'. The detergent will then enter the cell, and the tonoplast surrounding the membrane. Therefore, the higher concentration of detergent, the more detergent molecules, and this means there is more chance of the extra detergent molecules being taken up by the cell membranes. If more detergent is taken up by the cell membranes, more phospholipids will be repelled, and more cells will have damaged membranes, so more beta cyanine will be able to leak out, this is shown in my results e.g. at 0% concentration, the mean of absorbency gradient was 0.6, which show that it is very steep, which means that light could pass through easily, because no cell membranes were damaged. Where as, at 50% concentration the mean of absorbency gradient was 0.025, which shows that it was very near enough straight, which shows that light could not pass through easily because higher concentration will lead to the damaging of cell membranes, and the linkage of beta cyanine. This means the colour intensity will be greater, and therefore less liquid will be required to make the colour intensity the same as that of the standard.
There are different gradients in the results because one part of the graph has a moderately gently gradient compare to other parts, showing there is another reason in the reduction of % light transmission at other temperature and concentration ranges.
When the concentration range was between 50% and 100% concentration, the drop in light transmission, from 80%(A) at 50% concentration to about 20%(A) at 20% concentration was in proportion to the increase in concentration. The calculated gradient of this part of the graph is -3.33 C-1, meaning for every concentration increased the percentage light transmission would drop by 3.33%, which is of a much greater magnitude in gradient. The graph at this part has a much steeper gradient than the later part of the graph. This means that for the same amount of change in concentration, there is a greater change in the % light transmission than before. This was because apart from the increase in fluidity of the phospholipid bilayer, there was another factor affecting the permeability of the plasma membrane. Apart from the phospholipids bilayer, the plasma membrane also contains many protein molecules useful for cellular processes.
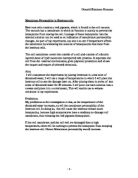
The 2nd graph on the last page (Graph of water potential in solution by water potential in beetroot cell) shows the relationship between the water potential of the sucrose solution and the change in mass of the beetroot discs. The point at which the line crosses the x-axis, the water potential of the solution is equal to the water potential in the cell. Flaccid and turgid cells occur as the result of the movement of water molecules. Flaccid cells occur when the water concentration (potential) of the surrounding substance is lower than the cell's water potential. A turgid cell occurs when the water potential inside the cell is much lower than that of the surrounding substance. Turgid and flaccid cells are a result of steep water concentration gradients between two materials.
Evaluation: The results that I have obtained show that my hypothesis was correct, however, the results that were collected follow the same pattern as results collected by similar studies carried out within our class, with a few anomalous results found in the graph. This could have been more beneficial to have repeated the experiment more times to make certain that the results were not gained through chance or by an external factor. The control experiment used was nearly highly accurate, using distilled water, which is the clearest possible liquid, meant that even the slightest deviation in colour could be detected by the colorimeter. But the colorimeter was not digital instead it was analogue, which means no correct reading to two decimal place, making the test un-fair.
Controlling the variables in the experiment is not an easy task. The first major problem is the size of the beetroot piece, because using a cm ruler to measure a 5cm beetroot was a hard task in its self. This could have been improved my using a mm ruler instead, also the pieces could be the same mass, but have a very different surface area to one another. This obviously alters the effect of the experiment because the amount of membranes increases, which results to an increase in damage, resulting an increase of cyanine leakage. The other difficult variable to maintain was the temperature of the heated surroundings, which can also damage the cell membrane. So to stop this from happing using a heat measure would make the test fair. With only basic equipment, using a Suring to measuring the distilled water at the concentration of detergent was made a complicated task, because the Suring collected bubbles, which made it harder to collect an accurate reading of the concentration of detergent, so by using an pipette to measure concentration would be more accurate. External variables were well controlled other than 3 small errors, because the beetroots were not properly time when left inside the detergent, this resulted to some anomalous results. If the experiment was to be repeated, the use of a proper controlled concentration may be a consideration as concentration varies over time exposed to air, and also a template made for cutting the beetroot pieces. So it is safe to say that the results are not completely reliable, so if repeated they may differ but the methods can be used universally. I think the mean source of error could have been control by measuring the volume, mass, the amount of cell present etc. also using different beetroots, to get a more wider ranger of the eukaryote group.
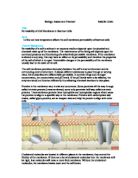
The results increased fairly steadily with one exception at 10% concentration where the amount of cyanine actually reduces. This is almost certainly due to experimental error. It is the breakdown of the lipids which make up the plasma membrane that causes 'holes' to appear in the membrane, allowing fluids to pass out freely, but when the concentration begin to increase, the proteins in the cells begin to decompose as well which blocks some of the holes and therefore slowing down the release of Anthon cyanine. It is these findings, which explain why cells cannot maintain life in extreme temperatures.
Conclusions: Using a Beetroot, as the sample is not a good representation of the whole eukaryote group. Other cell membranes may have better or worse concentration and heat tolerance, some may not be affected at all by the concentration or heat, however, using a beetroot does give a good representation of the theories behind the plasma membrane and how it behaves, but in terms of increasing the strategy of reliability of evidence is poor, because using a beetroot as the sample is not a good representation of the whole eukaryote group, so the results are not 100% reliable, nor the method, using beetroot to test the hole of the eukaryote group, but reliable in testing the theories behind the plasma membrane