U1 = (10 x 10) + (0.5[10]) (10 + 1) – 24.23 = 130.77
U2 = ( n x n ) + (0.5n ) (n + 1) - Σ R
U1 = (10 x 10) + (0.5[10]) (10 + 1) – 39.07 = 115.93
Smaller Value = 115.93
Critical Value for U = 23
115.93 > 23
Comparison of Mouthwash A against C:
U1 = ( n x n ) + (0.5n ) (n + 1) - Σ R
U1 = (10 x 10) + (0.5[10]) (10 + 1) – 24.23 = 130.77
U2 = ( n x n ) + (0.5n ) (n + 1) - Σ R
U1 = (10 x 10) + (0.5[10]) (10 + 1) –55.02 = 99.98
Smaller Value = 99.98
Critical Value for U = 23
99.98 > 23
Comparison of Mouthwash A against D:
U1 = ( n x n ) + (0.5n ) (n + 1) - Σ R
U1 = (10 x 10) + (0.5[10]) (10 + 1) – 24.23 = 130.77
U2 = ( n x n ) + (0.5n ) (n + 1) - Σ R
U1 = (10 x 10) + (0.5[10]) (10 + 1) – 19.16 = 135.84
Smaller Value = 130.77
Critical Value for U = 23
130.77 > 23
Comparison of Mouthwash B against C:
U1 = ( n x n ) + (0.5n ) (n + 1) - Σ R
U1 = (10 x 10) + (0.5[10]) (10 + 1) – 39.07 = 115.93
U2 = ( n x n ) + (0.5n ) (n + 1) - Σ R
U1 = (10 x 10) + (0.5[10]) (10 + 1) – 55.02 = 99.98
Smaller Value = 99.98
Critical Value for U = 23
99.98 > 23
Comparison of Mouthwash B against D:
U1 = ( n x n ) + (0.5n ) (n + 1) - Σ R
U1 = (10 x 10) + (0.5[10]) (10 + 1) – 39.07 = 115.93
U2 = ( n x n ) + (0.5n ) (n + 1) - Σ R
U1 = (10 x 10) + (0.5[10]) (10 + 1) – 19.16 = 135.84
Smaller Value = 115.93
Critical Value for U = 23
115.93 > 23
Comparison of Mouthwash C against D:
U1 = ( n x n ) + (0.5n ) (n + 1) - Σ R
U1 = (10 x 10) + (0.5[10]) (10 + 1) – 55.02 = 99.98
U2 = ( n x n ) + (0.5n ) (n + 1) - Σ R
U1 = (10 x 10) + (0.5[10]) (10 + 1) – 19.16 = 135.84
Smaller Value = 99.98
Critical Value for U = 23
99.98 > 23
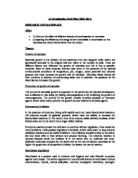
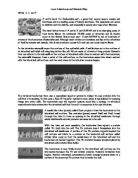
Effect of Mouthwash on Microccus Liteus Bacteria
Order of Zone of Clearance of Microbial Decay (Highest to Lowest)
- Mouthwash A
- Mouthwash C
- Mouthwash B
- Mouthwash D
Average Results
Ranking the Data
1) Mouthwash C
2) Mouthwash B
3) Mouthwash A
4) Mouthwash D
Σ R1 (Mouthwash C) = 55.02
Σ R2 (Mouthwash B) = 39.07
Σ R3 (Mouthwash A) = 24.23
Σ R4 (Mouthwash D) = 19.16
Comparison of Mouthwash A against B:
U1 = ( n x n ) + (0.5n ) (n + 1) - Σ R
U1 = (10 x 10) + (0.5[10]) (10 + 1) – 24.23 = 130.77
U2 = ( n x n ) + (0.5n ) (n + 1) - Σ R
U1 = (10 x 10) + (0.5[10]) (10 + 1) – 39.07 = 115.93
Smaller Value = 115.93
Critical Value for U = 23
115.93 > 23
Comparison of Mouthwash A against C:
U1 = ( n x n ) + (0.5n ) (n + 1) - Σ R
U1 = (10 x 10) + (0.5[10]) (10 + 1) – 24.23 = 130.77
U2 = ( n x n ) + (0.5n ) (n + 1) - Σ R
U1 = (10 x 10) + (0.5[10]) (10 + 1) –55.02 = 99.98
Smaller Value = 99.98
Critical Value for U = 23
99.98 > 23
Comparison of Mouthwash A against D:
U1 = ( n x n ) + (0.5n ) (n + 1) - Σ R
U1 = (10 x 10) + (0.5[10]) (10 + 1) – 24.23 = 130.77
U2 = ( n x n ) + (0.5n ) (n + 1) - Σ R
U1 = (10 x 10) + (0.5[10]) (10 + 1) – 19.16 = 135.84
Smaller Value = 130.77
Critical Value for U = 23
130.77 > 23
Comparison of Mouthwash B against C:
U1 = ( n x n ) + (0.5n ) (n + 1) - Σ R
U1 = (10 x 10) + (0.5[10]) (10 + 1) – 39.07 = 115.93
U2 = ( n x n ) + (0.5n ) (n + 1) - Σ R
U1 = (10 x 10) + (0.5[10]) (10 + 1) – 55.02 = 99.98
Smaller Value = 99.98
Critical Value for U = 23
99.98 > 23
Comparison of Mouthwash B against D:
U1 = ( n x n ) + (0.5n ) (n + 1) - Σ R
U1 = (10 x 10) + (0.5[10]) (10 + 1) – 39.07 = 115.93
U2 = ( n x n ) + (0.5n ) (n + 1) - Σ R
U1 = (10 x 10) + (0.5[10]) (10 + 1) – 19.16 = 135.84
Smaller Value = 115.93
Critical Value for U = 23
115.93 > 23
Comparison of Mouthwash C against D:
U1 = ( n x n ) + (0.5n ) (n + 1) - Σ R
U1 = (10 x 10) + (0.5[10]) (10 + 1) – 55.02 = 99.98
U2 = ( n x n ) + (0.5n ) (n + 1) - Σ R
U1 = (10 x 10) + (0.5[10]) (10 + 1) – 19.16 = 135.84
Smaller Value = 99.98
Critical Value for U = 23
99.98 > 23
From the data collected from my statistical test I can see that