Page of Lizzie Wright
Biology Coursework
My task is to investigate the effects of concentrations of sugar solutions on potato chip cells.
Planning
My controlled variables are to be the temperature the experiment is performed at, the starting length of the potato chips, the total quantity of solution to be used and the amount of stirring for each test.
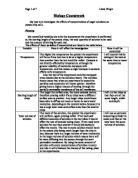
The effects of these variables if uncontrolled are listed in the table below.
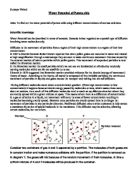
Osmosis is a special case of diffusion. It is the process in which water molecules diffuse from a higher water concentration to a lower water concentration through a partially permeable membrane. The larger the surface area, the more osmosis can take place.

My independent variable I will be changing is the concentration of the sucrose solution; while my measurable variable will be the length and mass of the chips.
I predict that as the sucrose concentration increases the size of the chips will decrease and become flaccid, and as the sucrose concentration decreases the size of the chips will increase and become turgid. This is again due to osmosis.
The osmosis theory states that when a plant cell is placed in a high water concentration, the water passes through the cell wall ...
This is a preview of the whole essay
My independent variable I will be changing is the concentration of the sucrose solution; while my measurable variable will be the length and mass of the chips.
I predict that as the sucrose concentration increases the size of the chips will decrease and become flaccid, and as the sucrose concentration decreases the size of the chips will increase and become turgid. This is again due to osmosis.
The osmosis theory states that when a plant cell is placed in a high water concentration, the water passes through the cell wall and membrane, through the cytoplasm and into the vacuole. The plant cell now has higher water potential than before, therefore it swells and becomes turgid.
When a plant cell is placed in a low water concentration and high sugar concentration, the reverse happens. The cell diffuses its own water concentration through the vacuole and cell wall, leaving the cell with lower water potential. The cell then shrinks and becomes flaccid. This makes the cell membrane pull away from the cell wall, and the cell to become plasmolysed.
Equilibrium is reached once enough water molecules have moved between the potato cells and the solution to balance the concentration on both sides of the partially permeable membrane. At this point osmosis stops.
I carried out some preliminary work to help me with my plan.
I tried using a boiling tube to hold my chips and solution in, using 20ml of solution in total. I used an accurate 25ml-measuring cylinder, which I could keep to the nearest ml. I decided I would measure the mass of the chips instead of the length to take my results from as this is a much more accurate way of doing it as you can only measure to the nearest mm with length but can measure to the nearest mg using mass. So I measured the mass of each one before and after leaving them in the solution.
I tested two potato chips, 6cms in length in 1M sucrose solution and two chips in pure distilled water, both of these also being 6cm.
I left them for only 25mins but it was enough to give me some results on which to plan my final experiments.
My results were as follows;
Analysis of Pre-tests: In distilled water the chips gained wait. This is because there was a higher water concentration outside the chip, so some water molecules moved through the potato chip cells cell membrane. The potato cell now has a higher water concentration than before, so has become turgid.
The chips in 1M sucrose solution did the opposite. There was a higher water concentration inside the cell, therefore the water diffused out into the solution, leaving the cell with a lower water concentration. This means the cell loses mass, and becomes flaccid, or plasmolysed.
Apparatus
Boiling tubes x 18
180ml 1M Sucrose Solution
180ml Distilled Water
Knife
Cutting Tile
18 Potato Chips Of A Similar Size
Paper Towels
Ruler
Balance
Measuring Cylinder
Cling film
I chose the above equipment for special reasons. I need chips of all roughly the same size, as this means that it will be easier to cut them to the same length using the knife. I will use boiling tubes instead of test tubes as they are larger and you can therefore keep a larger volume of solution in them. I will use the cling film to put over the top of the boiling tubes to stop any of the water molecules evaporating, which if happened, the concentration would be changed, proving unfair.
The following table shows how these items will produce reliable results.
Plan
For my experiments I will use six different concentrations of sucrose solution: 0M, 0.2M, 0.4M, 0.6M, 0.8M and 1M. This will provide me with a large range of results, from which to base my analysis on. I will test each concentration three times, so in total will need 18 boiling tubes. I will always use a total of 20mls of solution. I will weigh and record the mass of each chip after cutting them all down to 5.3cms in length. This means I will be able to collect reliable data for my results.
I will place all the chips in the solution as quickly as possible so they all have the same time. I will then leave them for 24 hours and then take them all out of their solutions. I will do this again as quickly as possible to make it a fair test. I will surface dry them with a paper towel to make sure I am only weighing the potato chip, rather than the potato chip and any excess solution. I will weigh each chip again so I can tell the mass change, and percentage difference later.
These are how I will mix all my concentrations so they are all exactly the same.
I will carry out my experiment as shown in the plan above. The evidence I will collect is the mass change of the potato chips in the range of different solutions. I will use 20cm3 of the final mixed solution in total for each test. I will perform each concentration 3 times so that I will in total have 18 tests. This is so that later, when recording and presenting my data I find any anomalous results and can then exclude them from my averages. This will make my investigation more accurate.
Safety
While I am around the tests I will always wear safety goggles, and stand all boiling tubes in boiling tube racks to ensure that they don’t role off the desks and smash.
I will also always make sure to replace all the stoppers of any solution and mop up any spillages that occur. Furthermore, when using the knife I will make sure to take care and use a tile underneath so I am less likely to slip with it.
Analysis
In my results table I have excluded any results which are anomalous and do not follow the desired pattern.
My results show that my prediction was right. As the concentration of sucrose solution increases, the percentage difference falls. They show that the lower the concentration of the sucrose solution, the higher the mean mass gain is.
This is due to osmosis.
The osmosis theory states that when a plant cell is placed in a high water concentration, the water passes through the cell wall and membrane, through the cytoplasm and into the vacuole. The plant cell now has higher water potential than before, therefore it swells and becomes turgid.
This is shown the potato chips left in sucrose solutions of 0M and 0.2M. They all gained mass, become turgid cells, but the chips in 0M became the most turgid.
When a plant cell is placed in a low water concentration and high sugar concentration, the reverse happens. The cell diffuses its own water concentration through the vacuole and cell wall, leaving the cell with lower water potential. The cell then shrinks and becomes flaccid. This makes the cell membrane pull away from the cell wall, and the cell to become plasmolysed.
This is shown in the potato chips placed in 0.4M, 0.6M. 0.8M and 1M as they all gained in mass but the chips in 1M gained the most and were the more likely ones to have plasmolysed and reached a state equilibrium.
There is a slight pattern showing in these results; there is roughly a +10 difference between each of the averaged results when it ranges from 0 – 1.0 M. The only exception to this pattern is between 0.8 and 1.0 M. Here there is only an increase of 5 percent.
I think my results and conclusions are reliable as I performed each test 3 times and excluded any anomalous results from the averages so they could not change the average that I would use to plot my graph (see previous page).
I have also performed all my calculations twice to check that I have made no mistakes when calculating the percentage change or averages.
I also feel that all my tests were reliable as I mixed 60cm3 of each concentration and then split it between the three using a separate measuring cylinder, but the same for each one. This therefore made sure that it was fair and that all the tests had the same amount and concentration of sucrose solution.
Evaluation
Evaluation of Data
I think on the whole that my results were quite accurate and therefore reliable. This is as the results are consistent with each other and my results follow my predictions I made at the start of the experiment which were based on scientific theories .
Almost all of my repeated results were the same with mostly only having 1% between them and the average, proving this point. The only set of results that do not follow this pattern is the set of 0.8M solutions. This could be down to the fact that there is an anomalie in this set of data so that average has been differed compared to the rest of the results.
It could also mean that the solution was not consistent in all of the boiling tubes or that some water managed to evaporate.
All of my mean results fitted onto a smooth s-curve in my graph showing again that they were accurate.
My measurement was accurate as I could measure the chips to a 1/100th of a gram. This was the reason why it was more accurate to measure mass than length difference.
Most of my results fitted the pattern I predicted at the beginning of the investigation. There were a few anomalous results that did not quite fit the pattern because they were over 5% difference to another chip in the same concentration.
These odd results could have been due to a number of reasons.
Evaluation of Procedure
I think my experiment went according to plan and the procedure I used was quite suitable.
It was a fair test as all the chips had the same amount of sucrose solution, the same length of time and the conditions they were left in were all the same.
There were more limitations to my experiment though:
- Measuring cylinder – It would have been much more accurate to use a burette or graduated pipette.
- Chips from different potatoes – Different potatoes have different dilutes and minerals, so some potatoes might have behaved differently. To improve on this you could take all your chips from one potato.
I think the limitation that had the most significance was if the chips were not dried properly. If you did not take off all the excess water then the results would be different and incorrect.
Next time, to improve my experiment I will use a burette or graduated pipette to measure out my concentrations of sucrose solution and make sure that I spend more time drying my chips after the experiment to ensure I get the maximum in reliability in my results.