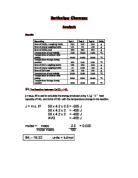
ALCOHOL FORMULA OF ALCOHOL AVERAGE TEMP THEORETICAL ENTHALPY
RISE VALUES
Methanol CH3OH 12.33 - 726
Ethanol C2H5OH 11.83 -1367
Propan-1-ol C3H7OH 12.15 -2021
Butan-1-ol C4H9OH 12.00 -2676
To work out the energy tranferred to water I could use the above table, and the following calculation:
Energy Transferred to Water = Specific Heat Capacity (4.2JgC-1) x Mass of Water x Change in Temp
- Methanol: 4.2 x 100 x 12.33 =5178.6 J
- Ethanol: 4.2 x 100 x 11.83 =4968.6 J
- Propan-1-ol: 4.2 x 100 x 12.15 =5103 J
- Butan-1-ol: 4.2 x 100 x 12.00 =5040 J
The Relative Molecular Mass can be calculated by substituting the appropriate values in the formula of each alcohol, the RMM needs to be known to calculate how many moles are in each alcohol. All of these calculations needed to be performed to obtain my final results.
No. of Moles = Mass Burnt / RMM
- Methanol: Mass used- 0.81g / 32 = 0.025 moles
- Ethanol: Mass used- 0.56g / 46 = 0.012 moles
- Propan-1-ol: Mass used- 0.5g / 60 =0.0083 moles
- Butan-1-ol: Mass used- 0.47g / 72 =0.0064 moles
Now i can work out the enthalpy by using the results from the previous two calculations.
Enthalpy = Energy Transferred to Water (J) / Moles of Fuel Burnt (mol)
-
Methanol: 5178.6 / 0.025 = 207.144 kJmol-1
-
Ethanol: 4968 / 0.012 =414.05 kJmol-1
-
Propan-1-ol: 5103 / 0.0083 =614.82 kJmol-1
-
Butan-1-ol: 5040 / 0.0064 =787.5 kJmol-1
Now each of these values can be plotted on a graph, against the number of carbon atoms. Below is the table of these results.
My Final Results Table
ALCOHOL ENERGY TRANSFERRED NUMBER OF MOLES ENTHALPY CHANGE
TO WATER
Methanol 5178.6 J 0.025 -207.144 kJ/mol-1
Ethanol 4868.6 J 0.012 -414.05 kJ/mol-1
Propan-1-ol 5103 J 0.0083 -615.83 kJ/mol-1
Butan-1-ol 5040 J 0.0066 -763.63 kJ/mol-1
Analysis
My prediction states that the amount of heat produced per gram of alcohol will increase as the number of carbon atoms per molecule increases. This was true, further proving that Butan-1-ol to be the most efficient, as it produced the most heat. Methanol, with the lowest relative molecular mass, was the least efficient of the four alcohols. Carbon atoms in alcohols do have an effect on the heat of combustion. As the number of carbon atoms increases the heat of combustion also increases, this is because every time a carbon atom is added, 12 is being added onto its' RMM
Evaluation
Although my own enthalpy values do not match up with the theoretical enthalpy values, they are of a similar order, giving, roughly, straight-line graphs. It is likely that the heat loss from my apperatus was constant throughout my whole experiment, therefore, the trends I discovered were correct but my apperatus was crude.
My results could never have been as accurate as the theoretical values because of the experimental errors that occured. My results are much lower than the theoretical values, the theoretical values most likey calculated all energy release, my experiments' calculation was heat energy alone. Other factors affecting the accuracy of my results could be that, sound and light energy will have been lost in the room. The beaker itself will have absorbed some of the energy. The alcohol containers had different amounts of alcohol and varying wick sizes, these factors contributed to the varying size of the flame; which sometimes never even touched the beaker.
Also the environment in which my experiment was conducted could have contributed to my low enthalpy values. A lack of oxygen could have caused incomplete combustion, this is, however, unlikely. The room temperature may have acted as a cooling agent.
I conclude that the classroom was a difficult environment in which to perform this experiment, there are so many potential ways of losing energy, as everything likes to gain heat energy. Apart from sufficient heat insulation and, no gusts of air to take heat away from the experiment there are no ways to obtain results close to the theoretical enthalpy values. From my graph i notice the obvious anomolous result is in the combustion of Butan-1-ol, however it wasn't abnormally anomolous and I think it will be due to natural error, I could repeat that part of the experiment again, to gain an average an re-plot it on the graph.