Variables
Dependent and independent variables:
The independent variable was the substrate concentration of the hydrogen peroxide, and the dependant variable was the volume of oxygen produced in the first 10 seconds. This was used to calculate the initial rate of reaction.
I varied the independent variable by using six different concentration levels; 0.0M (control group using distilled water), 0.04, 0.08, 0.10, 0.12, 0.16, 0.20.
To ensure reliability of results I carried out each experiment three times at each concentration level. I measured the dependent variable by measuring how much oxygen was produced at each concentration level in 10 second intervals.
Controlled Variables:
To ensure the results were reliable in this experiment I had to identify a number of controlled variables in the experiment set up. Firstly, when setting up the equipment I made sure the gas syringe was level, this is because if it is at an angle facing down, it would make it more difficult for the syringe to be pushed out.
Secondly, I timed and recorded the amount of gas produced, for each experiment, at exactly 10 seconds. I chose to record the amount of gas produced at every 10 seconds as I felt more than 10 seconds would not be precise enough and less than 10 seconds would not give enough time to measure and record the times, this would introduce new sources of error.
After each experiment I thoroughly washed out the test tube, this was to ensure that nothing would affect the results of the new experiment. Also, at the beginning of each experiment I made sure I would push the gas syringe back to 0cm3. This was to make certain that the results recorded were accurate, and not recorded as more gas having been produced.
Finally, I carried out the experiments three times. This was so I could get an average result. So, if any I got any anomalous results they could be easily identified.
Preliminary work
By doing the preliminary work I could see how much of each ingredient I needed and the best way to carry out my method.
Firstly, for the dilution of catalase, I decided to use 10g of liver homogenate with 100mls of water, this resulted in the catalase being too strong and the experiment finishing within a matter of seconds. I then decide to add 100mls of water to the liver homogenate, the reaction was still too fast, and would be impossible to record accurately. I kept adding 100mls of water until I got the reaction to maintain a steady speed. The dilution I decided to use was 10g of liver homogenate with 400mls of water.
By doing the preliminary work I also decided on how much enzyme I was going to inject into the test tube. I initially started with 5mls of H2O2, but once I carried out the experiment, I came to realise that this would be too much as my experiment seemed to finish too quickly. I decided then to use 4mls of hydrogen peroxide, and yet again the experiment had finished within a matter of seconds.
Finally, I found the right amount of hydrogen peroxide to use; which was 3mls. And finally by doing the preliminary work I found the best way in which to carry out the experiment. I initially started by making all the different concentrations on after the other. E.g. when doing the experiment for 0.2M, I only made enough 0.2M solution for one experiment when still had 2 more experiments to do. I realised this was extremely time consuming. So for my experiment I decided to make 20mls of each concentration and keep it in a beaker, so I had enough solution for all three experiments.
Risk Assessment
Method
-
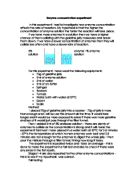
Firstly, we set up a control experiment, where we didn’t add any substrate to the liver homogenate. This is where we added 3cm3 of distilled water to the catalase. We observed that no gas had been produced. This established that the oxygen being produced was due to the substrate, hydrogen peroxide.
-
Secondly, I had to obtain the enzyme catalase that comes from liver. Once the liver has been acquired it then has to be homogenised. “The cells are homogenised in a blender, this breaks the cells up releasing organelles and cytoplasm.” Also, by homogenising the liver it will increase the reliability of my experiment. This is because the liver is normally lumpy, if I use a lumpy part of the liver in one experiment and a liquid part in another experiment this will give two very different results. And homogenising the liver will mean that it is all blended and the lumpy parts are smooth ensuring maximum surface area, so all the substrate can bind with the enzyme efficiently. The catalase was used after being refrigerated at 4oC.
-
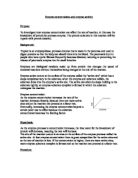
Thereafter I set up the apparatus as seen below. I then diluted the catalase with 400mls of water to 10g of the liver homogenate. I decided to use this dilution as in my preliminary work I started with diluting 10g of liver homogenate with 100mls of water. This resulted in my catalase being too strong and the experiment finishing too quickly.
- By the experiment producing oxygen so rapidly, this made it almost impossible to get the most accurate results therefore introducing more procedural errors.
-
I then placed 1cm3 of the liver homogenate into a test tube, using a pipette. I covered the test tube using a rubber sub-seal. The rubber subaseal allowed the hydrogen peroxide to be injected into the test tube, but at the same time preventing any oxygen from escaping.
- As soon as the hydrogen peroxide had been injected one person in my group started the stop clock, they would then tell the next person when each of the 10 second intervals were. The next person would then measure the amount of oxygen produced, and tell the last person, who would then record it. We used a space of 10 seconds as it gave enough time to accurately measure and record the amount of hydrogen peroxide used.
- Also, the four people, including myself, who carried out the roles, did the same role for each of the three experiments. By having the same person do the same job if a systematic error is discovered, such as a parallax error in reading a scale, a correction can be applied to all the data in order to minimise the effect of such an error in the experiment’s reliability.
-
Also, each job was done in routine, so we knew exactly what to do and each job would be completed efficiently. By having a routine, doing the roles in a certain order, this would minimise the chances of random errors, e.g. pushing back the gas syringe to 0cm3. I recorded each test for 60 seconds. I decided this as in my preliminary work I found that all the experiments had been finished by this time, yet it was not too early to stop the experiment just in case my results changed slightly and proceeded for longer.
- For this experiment, the concentrations of hydrogen peroxide I used were 0.04M, 0.08M, 0.10M, 0.12M, 0.16M, and 0.20M.
- I carried out this experiment a total of three times. This was to get an average result, and so later on being able to identify any anomalous results.
Analysis
Graph A
At the beginning of the reaction there is a high concentration of substrate molecules, so that there are many collisions between enzyme molecules and substrate molecules. Over time, the concentration of the substrate decreases, so there are fewer collisions. Therefore, the rate of reaction progressively reduces as the number of substrate molecules which can be catalysed by the enzyme decreases. The rate of reaction is shown by the gradient of the curve on the graph, which is high initially but then reduces. The number of filled active sites reduces.
Graph B
I have seen that my prediction was correct. I predicted that the more concentrated the substrate is, the initial rate of oxygen produced will be higher. By looking back at my results, I see that this is correct as in the first 10 seconds, at a concentration of 0.08M average rate of reaction is 164cm3 min-1, where as the concentration doubled to 0.16M, the amount of oxygen produced also almost doubled rising to 316cm3 min-1. I believe this happens as when the concentration of the substrate increases the rate of reaction also increases as there are more available substrate molecules to collide with the enzyme molecules, this allows more reactions to take place within a shorter space of time. This shows a linear relationship exists between substrate concentration and the initial rate of reaction.
There is a linear relationship between substrate concentration and initial rate of oxygen produced. Higher substrate concentration results in more collisions with enzyme molecules. An enzyme is “a protein molecule produced by living organisms able to catalyze, or facilitate, a specific chemical reaction involving other substances without itself being destroyed or changed in any way.” The enzymes provide active sites, where reactions can occur. At a given substrate concentration, there are a number of interactions/collisions between substrate molecules and enzyme molecules-this number is directly proportional to the rate of reaction. If the substrate concentration is doubled, there will be, in the solution, twice as many substrate molecules in each unit volume, so each enzyme molecule will produce an enzyme substrate complex, on average, twice as much with substrate molecules. This provides the link between the substrate concentration and rate of reaction being a linear relationship. Increasing the substrate concentration increases the probability of collisions between enzyme and substrate molecule, so causing the catalysation of the substrate to proceed faster.
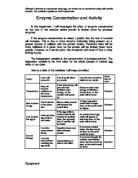
I also predicted that that the effect of substrate concentration is subject to the limiting factor of enzyme concentration, and above a certain concentration the rate of reaction will stop increasing. When the rate of reaction reaches its maximum possible rate, Vmax, all the enzymes’ active sites have been filled and no more oxygen can be produced. “The rate of an enzyme-catalysed reaction increases in direct proportion to the substrate concentration until the reaction reaches a maximum rate, Vmax. After the maximum is reached, all the active sites of the enzyme molecules are filled, so increasing the substrate concentration further as no effect on the rate of reaction.” In order to see Vmax on graph B, I will have to go up to a much higher substrate concentration. This will allow me to see where the graph tails off. (Refer back to figure 1, on page 2)
However, as there is a clear linear relationship on graph B, this shows the experiment was carried out with an excess of enzymes present, i.e. the limiting factor of enzyme concentration did not affect the results of this investigation. I know this as the graph does not level off (as shown in ‘factors affecting enzyme activity’). I also found that the rate of reaction is quickest at the beginning when there is a high concentration of substrate. Later, the volume of substrate decreased and so the reaction slowed down
Kent, M; Advanced Biology
Kent, M; Advanced biology