Enzyme Investigation
For our coursework investigation we explored how concentration affected the speed at which enzymes work in a reaction between hydrogen peroxide and catalase. The reaction looked like this:
(Catalase)
Hydrogen Peroxide Water + Oxygen
(Catalase)
2H2O2 2H2O + O2
Catalase is a common enzyme and is found in almost all living organisms that are exposed to oxygen. Enzymes are biological catalysts, meaning that they speed up reactions. Enzymes work by having an active site - an area shaped specifically so that only one type of substrate molecule can fit into it (similar to a lock and key). The interaction between the substrate molecule and the enzyme stresses or weakens some of the chemical bonds in the substrate. The product then leaves the enzyme.
In our preliminary experiment we decided to investigate both possible options and then reach a conclusion as to which one we did for our final experiment. The two options we had were:
. Change the concentration of Hydrogen Peroxide (Substrate)
2. Change the concentration of Catalase (Enzyme)
The equipment we used for our investigations was:
* Test tubes - We used these so that we had somewhere for the reaction to take place. The advantage of using test tubes is that they are see through so you can see what is happening in the experiment, and know when the paper disk has reached the top. All of the test tubes we used were the same size, as otherwise it would have been an unfair test (The paper disk would have had to float further if the test tube was larger).
* Syringes - We used these so that we could measure the amount of catalase solution to 0.1cm3. The advantage of using syringes was so that we could be accurate in measuring small quantities compared to pouring.
* Paper Disks - We used these as a way of measuring how much oxygen had been produced in the reaction. The advantage of using paper disks is that they would be pushed up by the oxygen produced in the reaction, and they were all the same size, meaning that it was still a fair test (If one of the paper disks was bigger than the rest, then it would have required more oxygen to push it to the top of the test tube).
* Palette - We used this as a place to dip the paper disks in catalase. The advantage of using a palette was that it was slightly concave, meaning that the paper disk could be completely covered in the Catalase solution whilst being easier to take out then if it was at the bottom of a jar full of Catalase solution.
* Tweezers - We used these to pick up the paper disks as if we picked up the disks with our hand then there would be a chance of us passing on something to the disks which wouldn't make the experiment a fair test. The advantage of using tweezers was that they were easy to pick to pick up the paper disks with, whilst being easy to clean up.
* Stopwatch - We used this as an accurate way of measuring the time it took for the paper disks to rise to the top of the test tube. The advantage of using a stopwatch instead of looking at the clock was that the stopwatch measured in milliseconds whilst a clock only measured in seconds. Also, the stopwatch could be easily started and stopped, whilst you can only look at a clock.
* Measuring Cylinders - We used these so that we could measure the amount of Hydrogen Peroxide to 0.5cm3. The advantage of using a measuring cylinder is that we could accurately measure large quantities of Hydrogen Peroxide before pouring it into a test tube.
The method we used for our prelims was as follows:
. We poured 50cm3 of hydrogen peroxide into a test tube, and poured 10cm3 of Catalase solution into the palette (using a syringe)
2. Using the tweezers, we picked up a paper disk and left it in the catalase solution for 30 seconds
3. We then took out the disc and placed it at the bottom of the test tube
4. Having restarted the stopwatch after taking the paper disk out of the catalase solution, we timed how long it took for the paper disk to rise to the top of the test tube.
We used this method as whilst it was easy to set up, it also gave us a clear ways to measure the speed at which the enzyme was working. What made the disk rise was the oxygen produced in the reaction, as the oxygen bubbles pushed the paper disk up towards the top of the test tube. Also, it was easy to change the concentration using this method as we could simply either:
. Change the concentration of Hydrogen Peroxide in the test tube
2. Change the concentration of Catalase put into the palette
The main variable which we had to control was the room temperature. We did this by taking note of the temperature at the start of each measurement, and if there was a noticeable change in temperature compared to the last measurement, then we would not take results as the room temperature would affect the results. This can be explained by collision theory, as temperature increases the number of collisions per second and increases the percentage ...
This is a preview of the whole essay
. Change the concentration of Hydrogen Peroxide in the test tube
2. Change the concentration of Catalase put into the palette
The main variable which we had to control was the room temperature. We did this by taking note of the temperature at the start of each measurement, and if there was a noticeable change in temperature compared to the last measurement, then we would not take results as the room temperature would affect the results. This can be explained by collision theory, as temperature increases the number of collisions per second and increases the percentage of successful collisions.
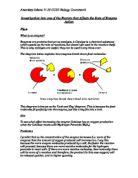
I predict that the higher the concentration of Hydrogen Peroxide, the less time it will take for the paper disk to rise. I believe this as the higher the concentration of Hydrogen Peroxide, the quicker the oxygen is produced in the reaction. This means that the paper disk should float to the top of the test tube quicker.
Preliminary experiment 1 - Hydrogen Peroxide Concentration
Concentration (H2O2)
Time to float (Sec)
Mean
9.51
0.07
00%
9.74
9.57
8.95
7.79
0.88
0.83
75%
0.83
0.64
3.10
0.03
3.82
4.05
50%
3.33
3.51
3.56
3.33
20.47
21.31
25%
21.55
21.61
21.66
21.91
We changed the concentration of Hydrogen Peroxide by adding water to the test tube (e.g. 75% was 37.5cm3 of H2O2 and 12.5cm3 of H2O (water)). The results in red are outliers - results that do not follow the trend of the others. We omitted these in the calculation of the means, to give more accurate results
Preliminary Experiment 2 - Enzyme Concentration
Concentration (Catalase)
Time To Float (Sec)
Mean
8.33
8.22
75%
9.65
8.40
8.56
8.49
2.02
2.03
50%
3.89
2.03
2.10
1.96
4.05
4.05
25%
3.93
4.05
4.15
5.96
For this experiment, we changed the concentration of Catalase in which the paper disks were left in. We did this by filling a syringe with a mixture of Catalase solution and water (e.g. 75% was 7.5cm3 Catalase solution and 2.5cm3 water)
After we had completed the two preliminary experiments, we had to decide what we would choose to be our independent variable. We settled on changing the concentration of Hydrogen peroxide, on the basis that there was less margin for error. This is because we found it difficult to get exactly the right amount in the syringe, whilst measuring the H2O2 in a measuring cylinder was much easier.
Having decided upon what we were doing, we had to look at what the different variables were. Our independent variable would be the concentration of Hydrogen Peroxide, as it is being purposefully changed. Our dependent variable will be the time it takes for the paper disks to reach the top of the test tube, as it is the observed result of the independent variable (Concentration of Hydrogen Peroxide) being manipulated. Our main variable which we had to control was the room temperature. This is because room temperature affects the results. This can be explained by collision theory, as temperature increases the number of collisions per second and increases the percentage of successful collisions. We controlled this by taking the room temperature before the start of each session, and if there was a noticeable difference in temperature then we would not take any results.
Another variable which we had to control was the concentration of Catalase solution. We had to make sure that it was the same for each experiment as the higher the concentration of Catalase solution, the quicker the paper disk rises to the top (as discovered in my second preliminary experiment). This is because there will be a higher concentration of enzyme to react with the substrate, making the reaction produce oxygen faster than if there was a low concentration of Catalase. We controlled this by not changing the concentration of Catalase from its original solution, meaning that there was no chance of human error, producing unfair results.
Also, we will use the same apparatus each lesson. A different size test tube, or a different make of stopwatch could alter our results. We will wash our equipment after each set of results, so there was no chance of the results being unfair.
Final Method
. We measured out X amount of Hydrogen Peroxide using a measuring cylinder and then poured in Y amount of water (So that X + Y = 50cm3). This was our concentration of Hydrogen Peroxide Stock Solution, and this was our independent variable.
2. We then poured this in a test tube.
3. We poured 10cm3 of Catalase solution into a palette using a syringe, and dipped a paper disk in the palette full of Catalase solution for 10 seconds using the tweezers.
4. After 10 seconds, we took out the paper disk and placed it at the bottom of the test tube, starting the stopwatch as soon as it touched the bottom.
5. We waited for the paper disk to begin to rise, and as soon as it reached the top of the test tube, the stopwatch was stopped.
6. We noted down the time, washed out the test tube, and started the experiment again.
7. Once we had repeated the same concentration 5 times, we changed the concentration by 10%, meaning that we eventually ended up with 50 results.
8. Once we had all of our results, we looked for outliers in the results and omitted them from the calculation of the mean for each concentration.
Results Table
Concentration of Hydrogen Peroxide (H202) Stock Solution (%)
2
3
4
5
Mean
00%
6.00
5.36
4.59
2.95
5.20
5.05
90%
6.06
6.10
2.00
2.06
6.14
6.10
80%
4.51
7.10
7.15
7.15
7.62
7.26
70%
8.08
7.02
8.22
8.16
8.32
8.20
60%
9.16
9.17
8.80
5.59
8.70
8.96
50%
0.61
9.54
9.72
9.52
9.87
9.66
40%
2.09
6.18
1.31
1.78
1.32
1.63
30%
2.11
2.69
3.14
2.10
4.29
2.51
20%
7.44
6.18
8.06
5.85
6.12
6.58
0%
27.14
26.54
25.80
26.24
30.49
26.43
Rate of Reaction Table
Concentration of Hydrogen Peroxide Solution (H2O2) Solution (%)
Mean Time to Float (s)
Rate of Reaction
00%
5.05
.98
90%
6.10
.64
80%
7.26
.38
70%
8.20
.22
60%
8.96
.12
50%
9.66
.03
40%
1.63
0.86
30%
2.51
0.80
20%
6.58
0.60
0%
26.43
0.38
Conclusion
After having finished the experiments and drawn graphs, I can reach the conclusion that the concentration of Hydrogen Peroxide does increase the rate at which oxygen is produced within a reaction. I can state this as the rate of reaction shows a negative correlation between concentration and reaction rate, and on the graph showing the time it took for the paper disk to reach the top of the test tube, the time increases as the concentration decreases. This shows that they have a negative correlation, meaning that the prediction I stated before the experiments was correct. I can back up my conclusion with evidence from my graph, which shows that when the concentration of Hydrogen Peroxide solution was at 100%, the mean time to float was only 5.05 seconds, compared to 10%'s mean time being 26.43 seconds. I believe that a difference of 21.38 seconds is enough to back up my conclusion. Also, none of the concentrations ranges overlap, which is often used to determine whether there is a real difference. The graph has a fairly constant gradient for the first up until around the 40% mark, and then suddenly has a steep increase in gradient.
I believe that the results turned out the way were as the higher the concentration of Hydrogen Peroxide, the quicker oxygen was produced in the reaction. The catalase speeded up the reaction, and with a higher concentration of hydrogen peroxide, there were more hydrogen peroxide particles for the enzyme to work on. The catalase speeded up the reaction by using the active site. The active site is specifically shaped so that only a certain type of substrate molecule could fit into it. The interaction between the substrate molecule and the enzyme stresses or weakens some of the chemical bonds in the substrate. This means that the reaction would take place faster, oxygen (which is a product in the reaction) would be produced faster and the paper disk would rise to the top of the test tube quicker than on a lower concentration. An increase in concentration means that there is an increase in the number of active sites, so more of the substrate molecules were weakened by the enzyme, as more could fit into an active site in a set period of time.
I drew a line of best fit on both graphs, however on the graph showing the time it took for the paper disk to reach the top of the test tube, the 30% set of results are quite a way off the line of best fit. This was probably due to human error e.g. not stopping the stopwatch in time, leaving the paper disk in the catalase solution for too long etc. Apart from this set of results, I believe that the results we obtained were accurate enough that I could make a prediction from them.
Evaluation
I believe that the data we obtained from our experiments was as reliable as possible. We made sure that our experiment was a fair test, and we repeated the experiment five times too add reliability. Of course, our results did obtain several outliers, all of which were removed from our final table, and were omitted in working out the means and ranges. The results we obtained we fairly consistent, with all of the results having a range of no more than 1.30 seconds. The only results which did not fit the line of best fit were the 30% Hydrogen Peroxide set of results. They are noticeably under the line of best fit, meaning that perhaps the results are not accurate. This may due to human error (e.g. not stopping the stopwatch in time, leaving the paper disk in the catalase solution for too long), due to an increase in room temperature, or due to a set of freak results. On the day we took these results there was not a noticeable increase in room temperature, which rules out that option. Whilst we did take a lot of care into making sure there was no chance of human error, this is a small possibility that this could have happened.
Another way in which we made sure our data was reliable was by our choice of equipment. We used the same equipment each day, as a different size of test tube or a different make of stop watch could make a significant change to our results (a larger smaller test tube would mean that the paper disk has further to float and a different make of stop watch could be slightly faster or slower than the one we were previously using, meaning that the time could be different). We also washed out or equipment after each experiment, just to make sure nothing was still on our apparatus which could alter the results.
* Test tubes - I believe that there are few choices in equipment that would have been as reliable as the test tube. We could have used a Petri dish; however there would have been less distance for the paper disk to float, therefore the results would have been less accurate, as there is less difference to tell between the different concentrations. Also, on several concentrations, the paper disk would float a small amount, stop for a while, and then carry on. If a Petri disk was used, then the paper disk would have floated to the top before stopping, making the results less conclusive. We could have used a measuring cylinder however, as these are taller than test tubes, and are see through so there would be no problem in terms of visibility.
* Syringe - I believe that whilst the syringe we used was accurate, if we had one which measured to 0.05cm3 than it would have meant that we would have had more confidence in experimenting with the concentration of Catalase. Whilst a syringe was hard to use and get exactly the right amount of Catalase and water, it was more accurate than a measuring cylinder so we did not really have any other options.
* Paper Disks - I believe that there were no other options of apparatus to use which would increase the reliability of results, as the paper disks were all of the same size, and they were light enough to be pushed up by the oxygen produced in the reaction, which few other materials were capable of doing.
* Palette - I believe that using a palette to hold the catalase solution was the best option, as its concave shape means that it can hold the solution, but is not too deep, so the disk is easy to take out. A different piece of equipment which we could have used is a Petri dish. Whilst a Petri dish would do a sufficient job, we chose to use a Palette as they are not as deep and easy to use when removing the paper disk as the sides are not as steep as the Petri dish.
* Tweezers - I believe that tweezers added to the reliability of results as they are manoeuvrable and easy to clean. This was important when we chose to use them as we had to be as quick as possible when picking up and dropping the disks, and tweezers were the best option. Also, tweezers could easily be washed and dried, which is important as they could still be carrying traces of catalase, hydrogen peroxide, or something else which could affect our results.
* Stopwatch - Whilst a stopwatch was much more reliable than a clock, the reliability of our stopwatch was questioned during our experiments, as often similar milliseconds were shown (e.g. 83 milliseconds were commonly shown in both preliminary experiments and our final experiments). This is probably due to us using a cheap brand of stopwatch, and if we had used a more expensive and reliable stopwatch, we would have more confidence in our results.
* Measuring Cylinder - I believe that whilst using a measuring cylinder was the right option, one with a higher grade of accuracy would have been more reliable. If we had a measuring cylinder that measured to 0.1cm3 than I would have had increased confidence in our results and my conclusion. We could have also used a syringe to measure out the Hydrogen Peroxide concentration, however this would have taken a long time (Our syringes could hold up to 10cm3 of liquid at one time, meaning that it would have taken 5 syringes full of hydrogen peroxide and water for each experiment, which is not practical).
If we repeated the experiments again, the main change I would make would be to repeat the experiments at least ten times instead of five. Due to time restrictions, we could only repeat the experiments five times, and after sometimes having to remove outliers, we ended up with only four results on some of the different concentrations of Hydrogen Peroxide. Whilst this still gives me enough information to reach a conclusion, I believe that with ten or more results my conclusion would be further backed up and strengthened.
I believe that our method was as reliable as it could be, as it left very little scope for human error. The only ways in which the method could have gone wrong would be if the paper disks were left in the catalase solution for too long, or if we were inaccurate in our timing. Since the method was reliable, we were confident that the results we had obtained were accurate. The one change I would make to our method would be to test the concentration of the Hydrogen Peroxide to 5% (e.g. 5%, 10%, 15% etc). This would mean that I would be more confident in my conclusion and also the line of best fit drawn on my graph would be more accurate.
I feel confident in my conclusion, as it is scientifically backed up by the results, meaning that I have evidence to support my claims. I feel as though my conclusion would have been further strengthened if I had done 10 repetitions of each concentration, meaning that my graph and line of best fit would have been more accurate and outliers would have been easier to spot. Another point that would have strengthened is if we had used the same solution of hydrogen peroxide each time. We had to have a new solution of Hydrogen Peroxide per session as it would have been producing oxygen throughout the day, meaning that it would not have been a fair test and the results would not be reliable as they are. This meant that we had to make a new batch of Hydrogen Peroxide solution each day, to the ratio of 1:9. We made the solution of Hydrogen Peroxide at this concentration so that it would take longer for the paper disk to rise, and we would have enough time to accurately measure how long it took (This meant that in the results, the 10% solution is actually only 1% Hydrogen Peroxide, the 30% was only 3% etc). Whilst we took great care in getting the ratio exactly correct each day, there is still a chance for human error to affect the results. However, we decided that making a new solution each day would produce more accurate results than sticking with the same one throughout the 2 week period in which results were obtained.
I believe that whilst we are confident in our conclusion, we could have further strengthened it with more results and more concentrations. This would have strengthened our results as with more repetitions of concentrations, we would be able to have produced a more accurate mean and outliers would have been easier to detect. More concentrations would have meant more results, and a graph with more results on means that the line of best fit will be more accurate and reliable. Whilst there were few changes we could have made to our equipment, I believe that having the reaction take place in a measuring cylinder instead of a test tube would increase the reliability of the results. This is because the paper disk would have further to float, meaning that the variables would not have a disproportionate impact on the results.