- Syringes
- Thermometer
- Stop-clock
- Water Bath
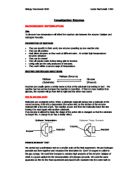
Method;
Using two test tubes, one will be filled with 5cm³ of powdered milk diluted with 100cm³ of water. This test tube will then be submerged in the water bath for five minutes.
The water bath will be maintained at a temperature of 20°C and this will warm the powdered milk mixture.
In the other test tube, 0.5g of the protein-digesting enzyme (Trypsin) will be added. This test tube with the enzyme is then diluted with 100cm³ of water. Then the mixture is tapped a certain amount of times to ensure a good mix. Then place this test tube will be placed into the water bath for 5 minutes.
The dilute powdered milk should be cloudy in colour when first placed in the water bath. The after five minutes add the test tube containing the enzyme in with the powdered milk and time how long it takes to breakdown the powdered milk.
You will know when the enzyme has broken down the powdered milk when the solution turns clear.
The experiment will then be repeated changing the temperature of the water bath by 5°C during each experiment.
I am going to set out my results table as shown below.
Secondary Resources;
- Biology for life (Second Edition) – M.B.V. Roberts
- GCSE Biology – Richard Parsons
Steven Vickery 11E
Obtaining Evidence
Safety
During the experiment I followed the necessary precautions I outlined in my plan. I labelled each test tube so there was no confusion during the experiment with my partner or passers by.
I cleaned each individual test tube to make sure the experiment was fair and free from anomalies. This gives me accurate results so I can study the uniformity of the experiment tests.
Results
Above is a table showing my results I obtained from the experiment also showing replicates.
To obtain the results I used precise and skilful equipment, to get the most accurate results. The most important facility was an electronic timer, which was accurate to the ms.
Steven Vickery 11E
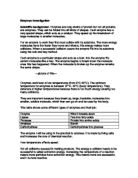
Analysing and Concluding
Explanation
There is no data for 20 to 25°C all the way through the results and replicates, because I suspect the enzyme was either working really slowly, or the enzymes had died due to the cool conditions. I think that the results obtained in the first two sets of results are more similar than the third set of results, but if I had more time, I would have pursued this matter. I would have done this by making another set of results. Then I could see if the third set of results had any comparisons with the first and second set of results.
Below is a graph representing the results from the first set of results.
Steven Vickery 11E
This graph shows a reasonably smooth curve, which gives a good indication in what sort of temperature range, it will denature the enzyme. Below I have constructed a graph showing both the first set of results and the second set of results.
These results have quite a similar trend, which is very obvious. However, I maybe able to draw some comparisons if I construct the same table but with all three sets of results so I will be to outline differences and similarities. However, I think after observing these results I think that set 3 may have been contaminated or incorrect, which may cause the results to be unfair. If so this will be a big set back in my project.
Steven Vickery 11E
As shown there is a more obvious difference between the results, Set 1-2 with Set 3. However due to lack of time I am unable to repeat the experiment again to make sure my results are fair and follow the same sort of direction. If you look at line of best fit you can see there is a definite difference with set 3. This is why I have to conclude that the set 3 of results are anomalous. However, the earlier sets of results have a definite pattern. They have strong positive correlations and both similar, in that they have nearly identical lines of denatured enzymes. This means that my first sets of results are reasonably reliable, so necessary conclusions can be drawn.
From this I can say that my prediction wasn’t explained thoroughly enough due to the fact that I only explained as the
Steven Vickery 11E
Temperature gets higher the more denatured enzymes become. Of course this is only partly true. From the results I can say if the temperature goes below 40°C or above 50°C then the enzymes won’t work as well or get slowly denatured. That’s why, when producing dairy products, products like cheese have to be broken down by enzymes at certain temperatures. Below is a table showing when the enzymes are in the best conditions assuming a temperature of 40°C.
Here, the first set shows that it worked the quickest in the fixed temperature of 40°C. The Second set also worked well in a low number of second also at a the fixed temperature of 40°C. However, our third set, which we said was unreliable anyway, worked best at a temperature of 35°C. This also alters the overall trend of what the temperature has to be to make enzymes work best.
Steven Vickery 11E
Above is a table showing rate of reaction for both results set 1 and 2. Below is a graph showing the rate of reaction for the enzyme when breaking down the powdered milk. From this I will be able to determine in which environment enzymes work the best.
Steven Vickery 11E
Evaluation
I think that overall I attempted this experiment to the best of my ability and thanks to this commitment I obtained some good sets of results.
The experiment was successful, but due to contamination, in the third set of results information and data I collected was wrong, so I could make no similarities between set 3 and set 2 or 1. My results could have been more reliable if I washed the test tube with water and not drying it, which was maybe one of the reasons why that the third set of results was anomalous. Another problem was during the experiment when a test on the broken down powdered milk had to be compared with the control. Sometimes our analysis was inaccurate when it may of needed more powdered milk to be broken down. I think I should have washed all of the equipment used, (apart from the stop clock) because the other equipment may also have been contaminated from previous experiments.
I think the experiment results were sufficient to reach a basic conclusion, but more data would have made the averages more accurate. I think the anomalous results throughout the experiment were largely as a result of a few points.
- Inaccurate timing
- Contaminated equipment
- Contaminated solutions
These were potentially a big set back but if I was given extra time to collect additional data, my results would be accurate and more accurate conclusions could be made.
I think I could have improved the experiment by using a larger range of enzymes, so an overall comparison could be made. Different dairy products could be used so we could find out rate of reaction on certain foods. A more accurate scale of temperatures could be used to see what degree the perfect temperature is. I would have carried these experiments out if I was given extra time.