Scientific Research
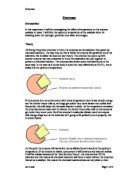
The rate of an enzyme reaction is measured by the amount of substrate changed or the amount of product formed during a period of time. When the temperature is low (5-30 degrees), increasing the temperature provides heat energy, therefore increasing the amount of kinetic energy resulting in the molecules moving faster making more collisions and so producing a faster reaction between the substrate and the active site. This also then produces more enzyme-substrate complexes forming more products.
However, as the temperature increases to above 40 degrees (near enough its optimum temperature) the enzymes collide and vibrate so energetically that the hydrogen bonds holding the globular tertiary structure break, changing the shape of the enzyme and its functions. This affects the active site where the substrate will no longer be able to fit into. The enzyme is then said to be denatured.
In the class’ average data, it is seen that the reaction appears to occur at zero degrees working its way up to 151mm at 40 degrees dramatically. It is seen that here, at around 40 degrees, is the enzymes optimum temperature and so after 40 degrees the enzyme begins to break its tertiary shape very quickly because of its vibrant vibrating and would probably denature a little after 80 degrees.
Evaluation
In the class’ data, there appears to be no anomalous results. However if the height of the froth between 40 and 50 degrees was spread out further, the results would be seen to be more accurate as a variation between the optimum temperature and 50 degrees needs to be recognised.
There are a few sources of error. Such are,
- Some groups in the class may have not carried out the experiment with the test tubes kept in the water bath, which could affect the temperature levels, therefore affecting the rate of reaction/height of froth.
- Measurements of substances may not be accurate.
- Are the measurements that are taken actually used up in the experiment? For example when yeast is added to hydrogen peroxide, is all the solution then able to be used? Sometimes, remains are kept in the test tubes, unless a syringe is used. This technique of using a syringe should be tested/proved to see if this is true.
- It is quite unlikely that the temperatures are exactly what were read. Was the water-bath actually 4 degrees?
- There may be problems with timing one minute. Stopwatches may differ from group to group or some groups may have gone beyond or stopped the time too early.
Limitations
The first limitation that is easily recognisable is that the numbers of temperature readings are not enough. More experiments using several more temperatures need to be carried out in order for the results and the curve on the graph to be more clear and accurate and for a proper understanding of the experiment.
Secondly, as a group, the experiments should have been repeated at least four times, as not all groups had carried out the task well, so repetition could verify the results. As a result, both limitations could lead to the failure of the whole experiment as not getting the sufficient amount of data required, limits the data and results and the understanding of enzyme reactions.