Apparatus
Spring (that can hold 10N), 20 one half Newton weights, metre rule, clamp stand, stop watch (ms), calculator
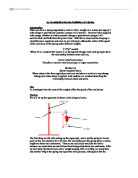
Diagram
Fig 1 Fig 2
Method
Set up apparatus as shown and attach desired weight. Slacken so the bottom of the spring is 7cm from its tight position them let go. When the spring reaches point a start the stopwatch and let the spring do 10 complete oscillations (to improve accuracy) before stopping the stopwatch and recording to the nearest millisecond. Repeat the same weight 4 times (again to improve accuracy) then calculate a mean for the results and divide by 10. This gives an overall result for that weight. Starting with ½ a Newton repeat the experiment at ½ Newton intervals up to 10 Newtons.
Fair test
We are ensuring the test is fair by repeating the experiment (as outlined above) so we have the equivalent of 40 individual readings for each weight, thereby almost cutting out all human or equipment error. Also, all readings are taken to the smallest possible range for every piece of equipment: ruler to the nearest mm and stopwatch to the nearest ms, thereby increasing accuracy. The same spring is being used so any difference in spring tightness or durability is eliminated.
The design choices are based on a model experiment demonstrated and information from secondary sources (e.g. textbook). I feel this is the best possible way of testing this theory within classroom restraints.
RESULTS AND GRAPHS ON SEPARATE SHEET
Conclusion
After processing the raw data (taking the mean of each set of results and dividing by ten to have the period of 1 oscillation) I produced two graphs: One of the period of 1 oscillation and one of the period of one oscillation compared with the period squared and the period divided by 1.
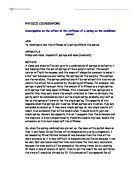
The first graph basically shows a strong positive correlation between the Weight and Time, giving a smooth curve with a mid-point of approx. 0.8 seconds. The curve does not, however, go through the origin, though if I had plotted zero Newtons it would have. The curve is turning at the same angle throughout the graph and there are no anomolys to this. So, the weight does correlate to the time for an oscillation though it is not directly proportional as I had predicted. Reasons for this conclusion may be that as we repeated the experiment the spring changed it’s properties, possible becoming more flexable and thus leading to a greater speed of oscillation. The main reason for the correlation is that because the weight is larger, the downward force also becomes greater and the spring is pulled further down. The spring takes longer to change energy from the potenetial (greatest at the points B and C) to kinetic energy (greatest at point A). Because of the combined factors of a greater pull and slower energy change the spring takes longer to oscillate.
The second graph is of more value than the first. Not only does it show the period of oscillation but also 1/period and period squared. Whilst 1/period only shows a little corellation and gives no new information the period squared looks much more like it is directly proportional to the weight, even going through the origin. This shows that when you double the weight, you also double the period squared or W p.
All the lines on the second graph cross each other at 1 second, because 1 squared and 1/1 both equal 1.
My prediction was correct in that the weight and the period do correlate. However, I was was wrong in that the period is not proportional to the weight. We did not exceed the elastic limit so my prediction that the trends would not continue after the elastic limit is passed were not tested.
So, weight is not proportional to period but period squared is proportional.
Evaluation
Because we repeated the result 4 times for each weight and did 10 oscillations instead of 1 for each result (thereby dividing by 10 the human error) and used the same spring, I feel the results are accurate enough to support my conlusions that weight is not proportional to period. This is because any anomalous results sould have shown up on the graphs which was not the case and the graph curve is smooth.
The only difficulty encountered whilst taking the results was to measure the 2.5cm slackness of the spring (to provide momentum for the oscillations) for each result. The oscillating spring sometimes caught the ruler that measured the slackness, thereby chaning the properties of the oscillation and making the result useless. We fixed this problem by moving the ruler futhur away when taking the measurement and removing it immediately.
We could improve accuracy by lengthening number of oscillations per result (eg to 100 ocillations per result). However, the accuracy was adequate for our requirments.
Broadening the range of weights (using a spring with a higher elastic limit) would give are bigger outlook and do more to disprove my predictions. Another experiment could be done to see if the other main factor effecting the oscillation of a spring, namely the amplitude of the spring, effected is as much, if at all.
BEN SELLERS 4