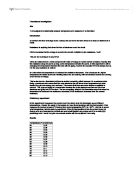
First of all, I immersed each thermistor into Beaker 1 and after sometime, I transferred the thermistor into Beaker 2, noting the time taken for the digital multi-meter to reach a steady voltage value. The values taken are shown below:
From the values taken, it can be deduced that the bead thermistor was better of the two in terms of response time because it took the shortest time to show a steady value when a sudden change in temperature was applied.
APPARATUS
- Bead thermistor
- Power supply, 5V dc (When a multi-meter was connected across the supply, it read ‘6.47V.’
- 4mm wire leads
- Resistance substitution box
-
Beaker, 400cm3 with water
- Thermometer
- Metre rule
- Digital multi-meter
- Candle with matchbox
- Cardboard box with scissors
- Retort stand
- Etc
EXPERIMENT #1
Investigation
For the first experiment, I decided to monitor the effect of temperature on the resistance of a thermistor.
Procedure
- Set up the potential divider circuit as shown in the first page.
-
Using an electric kettle, boil about 200cm3 of tap water. Then pour a portion of the water into a polystyrene cup and record the temperature with a thermometer.
-
When the temperature is at 100oc, fully immerse the thermistor into the water and cover the top with a lid to minimise heat loss to the surroundings. Record the voltage reading on the digital multi-meter.
-
Repeat the procedure for every 10oc interval down to about 20oc, which is approximately the minimum temperature that the water can reach.
-
Place several blocks of ice cubes into a clean beaker, and crush the ice into small pieces to increase its surface area. When the temperature reads 0oc, record the voltage reading, making sure that the thermistor is completely immersed in the melting ice.
-
Allow the temperature to increase to 10oc, and record the voltmeter reading.
- Repeat the experiment to obtain two sets of values of temperature and their corresponding average voltage, and calculate its average.
-
Transfer all the values in tabular form and plot a graph of voltage/V against temperature/oc.
Table of Values & Graph
Evaluation of Graph
When a graph of voltage/V against temperature/oC was plotted, a ‘best-fit’ curve can be drawn. From the line, it can be deduced that the voltage decreases with the increase in temperature. As temperature increases, the resistance of the thermistor decreases.
Error Report
- Not all the points fit into the curve, meaning that there were some inaccurate values. This is probably due to some heat loss or gain from and to the surroundings although a polystyrene cup and lid was used to minimise it.
-
When I used the melting ice to record the voltage reading, the temperature was not exactly at 0oc. The ice cubes were not fully grinded to give a larger surface area and were virtually still in a solid state, and therefore there might be a little error in its voltage reading.
- For each temperature, the voltage reading on the multi-meter slightly fluctuated, therefore I had to repeat the experiment twice and calculate the average to minimise the percentage error of the values.
EXPERIMENT #2
Investigation
For the second experiment, I performed a similar kind of experiment, but from a different sort of perspective. In this case, instead of using a liquid medium with varying temperatures, I have used a source of heat which releases a reasonably constant and significant amount of heat. And I plan to monitor the effect of distance on the resistance of the thermistor by altering the distance between the thermistor and the candle.
Procedure
- Assemble the potential divider circuit used in the previous experiment.
- Set up the apparatus as shown below, placing the thermistor horizontally 4cm away from the tip of the candle. Light the candle with a match, and replace the cupboard ‘wall’ around the apparatus to minimise external forces (draughts, etc) acting on the flame and thermistor. Record the final steady voltage reading on the multi-meter. Put out the flame on the candle.
- Adjust the distance between the thermistor and the candle using the metre rule, increasing the distance by 1cm each time. For each distance, record the voltage reading produced on the multi-meter.
- Obtain a range of values of distance and corresponding voltages until there is no further change, and write them in tabular form. Plot a graph of voltage/V against distance/cm.
Table of Values & Graph
Evaluation of graph
As the distance between the tip of the thermistor and the candle increases, the voltage increases linearly up to one point, when the voltage remains constant despite the further increase of distance.
This is because the temperature around the tip of the thermistor is obviously higher when it is closer to the heat source (candle); say 5cm away, than when it is at, say 10cm away. Therefore, as the temperature decreases with increasing distance, the resistance of the thermistor will be higher, and as a result, the voltage reading increases. It remained constant from the 14.0cm onwards because the change in resistance of the thermistor was quite tiny, and therefore it could not be detected by the multi-meter.
Error Report
- I could not position the thermistor any closer to the candle than 4cm; otherwise it would melt due to the high temperature.
- Despite the use of a cardboard ‘wall’, there would still be external forces acting on the apparatus such as light from the laboratory ceiling lamps; therefore the readings recorded may not be totally accurate. This error can be minimised by performing the experiment in a dark room, where the air is still and light is absent. A cardboard ‘wall’ can be excluded in this case.
- The change in output was not largely significant, with a rise of only around 0.01-0.08 V for each reading taken, and I was only able to obtain distance values for up to 16cm. A more sensitive means of detecting changes in output should have been used, such as a Wheatstone bridge circuit, which is an accurate way of detecting and measuring small changes in electrical resistance, and is basically made up of two potentiometers connected in parallel with a galvanometer between them. A typical circuit would look like this:-
- As the candle burns, the wax melts, therefore the distance between the tip of the candle and the thermistor will automatically increase as the candle has shortened. Therefore, after recording a voltage value for a particular distance, the flame must be put out and the distance must be re-measured using the metre rule before continuing with the experiment. This might lead to a small systematic error.
- The amount of heat produced by the candle is not exactly consistent every time, therefore there might be some slight random variation. Using a light bulb instead is an alternative, but the power of the bulbs available is not high enough to be detected at large distances by the thermistor. Using a Wheatstone bridge circuit would certainly eliminate this problem.
ANALYSIS OF EXPERIMENT 1 & 2
How does the resistance of the thermistor affect the p.d. across it?
From the experimental data, it can be deduced that an increase in temperature causes the voltage value on the multi-meter to decrease. In Experiment 2, a larger distance means a decrease in temperature, because as distance increases, the intensity of the heat from the flame decreases.
But why do the voltage values decrease? Let’s just presume that when the thermistor is subjected to room temperature, the voltage reading on the multi-meter is 2.5V, and the resistance of the resistor and thermistor is 100 ohms each. When the thermistor is subjected to a change in temperature the following occurs:-
Decrease in R (Increase in T) Increase in R (Decrease in T)
The potential divider circuit is in series, therefore the potential difference across each component is proportional to its resistance. Therefore, the voltage reading would be:-
Vout = (50/100+50) x 5V Vout = (100/100+50) x 5V
= 1.67 V = 3.33 V
The voltage reading decreases. The voltage reading increases.
CIRCUIT DESIGN OF APPLICATION OF THERMISTORS
A thermistor has a wide range of commercial applications, and one of them is to control output devices such as water heaters and temperature alarms. One example of this is a water temperature control in swimming pools. A suitable circuit design for this application is as shown below:-
Thermistors are used to monitor the temperature of the water in swimming pools, whereby it produces varying voltage values in proportion to its resistance, which is dependent on the temperature of the water in the pool. This thermistor is connected to a logic circuit which can be used to switch a heater device on or off. In more detailed explanation, the sensor is fitted to an AND gate, which is connected to a transistor-operated relay. This would switch the heater on or off according to the voltage value.
The transistor-operated relay would switch the heater on when the voltage value is higher than its optimum range (the temperature goes below a certain value), and off when the voltage decreases below its optimum range (the temperature goes beyond a certain value). By switching the heater on and off, the temperature of the water in the swimming pool is maintained at a suitable level.
CONCLUSION
Sensitivity
Sensitivity can de defined as the ratio of the change of output to the change of input. The thermistor is very sensitive as it is able to detect very small changes in resistance. Using more sensitive output devices like a Wheatstone bridge circuit would illustrate its sensitivity. In quantitative terms, the sensitivity of the thermistor is:-
Sensitivity = change of output / change of input
= 5.01 – 1.35 / 0 – 100
= 0.0366V/oC
Using calculations as stated below, it can also be deduced that the thermistor has a varying sensitivity, and is more sensitive at lower temperatures.
0 - 50oC Sensitivity = 5.01 – 2.42 / 50 – 0
= 0.0518V/oC
50 – 100oC Sensitivity = 2.42 – 1.35 / 100 – 50
= 0.0214V/oC
Response time
The response time is the time taken by a sensor to respond to a change in input. When a sudden temperature change was applied, the bead thermistor was able to respond to it 3 times faster than the thermistor probe, therefore comparatively, its response time is very rapid. When the thermistor is subjected to a change of temperature of 80oC, it took 7.30 seconds to show a steady value on the multi-meter.
Resolution
The resolution is the smallest change it can detect in the quantity it is measuring, or the precision with which the measurement can be made. When performing the experiment, the voltage value on the multi-meter constantly fluctuated, therefore an average had to be taken.
Random error
The graphs plotted were best-fit curves, whereby there were several values that did not coincide with the curve. Therefore there are small unsystematic variations present in the experimental data.
Systematic error
There is only a small systematic error because disturbing influences are minimised so that the thermistor would not be affected in terms of its resistance.
Overall comment
Due to its high sensitivity and rapid response time, it can be deduced that the thermistor is a good sensor system.