Results
Conclusion
No times were obtained for the milk when it was at room temperature and 60ºC. This shows that the rennin did not have enough kinetic energy to work when the substrate was at room temperature and it had denatured when the substrate was at 60ºC. So these temperatures cannot be used in the main experiment. Therefore it was decided that the lowest temperature used in the main experiment would be 25ºC and the highest temperature would be 55ºC. The temperature range was not too low so that the enzyme would not have too little kinetic energy and it was not too high so that the enzyme would not denature too much.
Prediction
I think that as the temperature increases, the smaller the amount of time the rennin will take to clot the milk. Therefore as the temperature increases, the activity of the rennin will also increase. As seen in the preliminary experiment, if the temperature is too low it takes a long time for the rennin to coagulate the milk. This is because as rennin is an enzyme, it will not be able to have enough kinetic energy for the reaction to take pace. The rate of reaction is extremely slow due to the very slow diffusion of enzyme and substrate molecules. Conversely, as the temperature increases beyond approximately 37°C, which is its optimum temperature, the active site of a rennin molecule will start to denature and so the ‘lock and key’ method would become less and less effective. Beyond a certain temperature the enzyme will have fully denatured and so it will no longer fit into the substrate.
Rennin’s optimum temperature is about 37° because it works in the body of a mammal and a typical mammalian body temperature is around 37°C. At low temperatures, the reaction would be very slow because the molecules are moving relatively slowly. The substrate molecules will not often collide with the active site of the enzyme and so bonding between the pairs of molecules is rare. As the temperature increases, the enzyme and substrate molecules gain more kinetic energy, so they move around at a greater speed. The collisions between the substrate and enzyme molecules are more frequent and this allows a greater number of substrate molecules to enter the active site of the enzyme more often. When they do collide, they do so with more energy. It is easier for bonds to be broken so that the reaction can occur.
As the temperature increases even further, the speed of movement of the molecule also increases further. However, when the temperature reaches a certain value, the structure of the enzyme vibrates so energetically that some of the bonds holding the enzyme molecule in its precise shape begin to break. The primary structure of rennin, which is an enzyme, is made up of proteins that are divided into sub-units called amino acids. These are called peptides bonds. A polypeptide or protein molecule may contain several hundred amino acids. As the temperature ascends to beyond the optimum temperature required, there are an increased amount of permanent bonds made. Nonetheless, as these bonds are made the secondary structure of rennin has an effect on how the enzyme retains its shape. Amino acids in a polypeptide chain have an effect on each other even if they are not directly next to each other. The chains bend upon themselves and so distorting the shape of the molecule. The thermal energy breaks the hydrogen bonds holding the secondary structure of the enzyme together, so the enzyme, and especially the active site, loses its shape to become a random coil. The substrate can no longer bind, and the reaction is no longer catalysed. At very high temperatures this is irreversible.
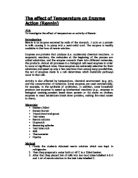
The graph for the time against the temperature should look like this:
At first the rennin takes a long time to coagulate the milk. As the temperature rises and the molecules begin to gain more kinetic energy, the time starts to decreases, whereby when it reaches around 40°C, the time is the smallest throughout the experiment. As the temperature surpasses the optimum of the rennin, the time begins to increase once more. At this point the active sites of the rennin molecules begin to get more denatured until eventually they cannot denature any further, so the time would remain constant.
The second graph of the temperature against the rate of reaction should look like this:
This is a typical curve which can be applied to the activity of almost any enzyme taking into account that the optimum temperatures for certain enzymes are different. This is the opposite of the time against temperature graph. The curve goes through the origin because at 0°C, the molecules do not have enough kinetic energy to move and collide with the other molecules causing a reaction to occur. The rate then slowly increases until it attains its optimum temperature around 40°C. Here the rate is at its peak. From here it slowly decreases due to the denaturing active sites of the rennin molecules, whereby it reaches the point where there is no further reaction at a certain temperature. This is where the reaction stops and so the rennin is no longer able to coagulate the milk.
Plan:
Apparatus Diagram of Apparatus
Test tubes
1 Boiling Tube
Stopwatch
Test tube rack
2 Syringes wit measuring guides
Big Beaker (acts as a water bath)
Thermometer
Clamp
Clamp stand
Bungs
0.5% rennin
Milk
∙ The clamp and the stand should be set up. A boiling tube should be placed in the clamp and rotated until it is slanted at an angle of about 45° to ensure that a fair test is carried out. This is so that all the test tubes are at the same slant height when they are being tested.
∙ Three test tubes should be placed in the test tube rack.
∙ 5ml of milk should be measured out using the syringe and this should then be poured into a test tube. This should then be repeated twice more for the other two test tubes.
∙ The temperature of the milk in each test tube should then be measured. It should approximately be at room temperature in which case the milk should be heated, as it is not at the correct temperature (30°C).
∙ This can be done by putting quite hot water into a large beaker. A thermometer should then be placed into one of the test tubes containing the milk and the all three test tubes should be placed in the beaker which acts as a water bath. The thermometer should be placed in each of the test tubes alternately to ensure that the correct temperature is being attained for each test tube.
∙ When the temperature reaches 30°C, the test tubes should be taken out of the water bath. If any of the test tubes exceed the required temperature, a thermometer should be paced in that particular one and it should then be left to cool down until it is at the precise temperature.
∙ 1ml of rennin should be measured out using another syringe.
∙ Once they are all at the required temperature, 1ml of the rennin should be added to the test tube. At the same time, the stopwatch should be started and a bung should be placed on the test tube.
∙ This should then be repeated ten seconds later with the second test tube, i.e. when the initial test tube has had ten seconds to coagulate. Once again, this should be repeated with the third test tube of milk at 30°C, but this time the rennin has to be added twenty seconds after the rennin has been added to the first test tube.
∙ The test rubes should be placed in the boiling tube in the clamp every 15s. Once it can be seen that the milk is thickening substantially but not quite fully coagulated, the test should be carried out every 10s. This will be seen when the milk only slightly tips when it is placed in the boiling tube. The test tubes should be checked until the time has exceeded 12 minutes whereby it has to be stated in the results that there was no reading obtained for that particular experiment. Once the milk has fully clotted, it will no longer ‘slant’ when it is put at an angle.
∙ The readings and repeats for the milk at 30°C have now been completed.
∙ The whole process should be repeated with repeat readings to ensure accuracy, except the temperature of the milk should be changed because this is the variable in this investigation. The temperatures that the milk has to be heated to are 30ºC, 35ºC, 40ºC, 45ºC, 50ºC, and 55ºC.
∙ All the readings should be noted in a results table.
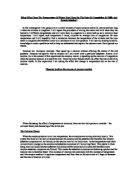
Precautions to undertake
- Care has to be taken to ensure that the two samples of rennin and milk do not get cross-contaminated. This can be done by using separate syringes to measure out both substances.
- Care should be taken when handling hot water. Goggles may be worn although they are not always necessary.
Results
KEY
* = An anomalous value so it is not used to calculate the average value.
- = Result not obtained because it took over twelve minutes
(3sf) = Value has been rounded to three significant figures
(2sf) = Value has been rounded to two significant figures
NB: The rounded values for the time at 45ºC and 55ºC were used to calculate the rate of reaction.
Conclusion
The results obtained are not very similar. However, the graph for the time against the temperature agrees with my prediction, even though the predicted peak point was at a lower temperature than the actual graph obtained. At 45ºC, the time taken for the milk to fully coagulate was the least and therefore the rate of reaction was the greatest. The shape and trends of the graphs support my prediction; however as some times went above 12 minutes, no results were obtained and this was not accounted for in the prediction. Consequently, there were fewer points on the graph which give less accurate overall curves. There are trends in the results which show that the time decreases to a certain point, but after this point (in this case it was at 45ºC) the time starts to increase once more as the temperature begins to travel past the optimum required for this reaction. In this aspect the results did support the original prediction, even though the prediction did not state that same optimum temperature and in reality the optimum temperature was higher than expected. As temperature increases, the molecules, according to the 'Kinetic Theory' move faster, due to increased energy. Therefore, the enzyme and substrate molecules will meet more often and the rate at which the product is formed will increase. However, as the temperature continues to rise the hydrogen and ionic bonds, which hold the enzyme in shape, break and the active site will no longer accommodate the substrate. The enzyme is then said to be denatured. If the temperature falls below 37°C, according to the kinetic theory, the enzyme and substrate molecules will not be receiving as much energy, and therefore their movement will slow down as the reduced heat reduces the amount of energy the molecules are receiving. This will reduce the number of collisions between the rennin and the milk particles, and there is a higher probability that these collisions will be unsuccessful due to the lack of energy. Therefore the rate of reaction will reduce.
Once higher temperatures are restored, the rennin will regain its catalytic influence. Above 37°C, which is rennin's optimum working temperature, as this is body temperature, and rennin is found within the stomach of young mammals; the rate of reaction will decrease. This is because the rising temperature affects the hydrogen and ionic bonds which determine the shape of the enzyme. As these bonds are broken the shape of the active site changes and the molecules of caseinogen (in the milk) can no longer occupy them. The rennin is now denatured and the rate of reaction will become zero. If the temperature is increased above the optimum level, then a decrease in the rate of reaction occurs despite the increasing frequency of collisions. However, the molecules vibrate so energetically that certain bond that make up the secondary and tertiary structure begin to break and so the shape of the enzyme is no longer exact. The secondary and tertiary structures of the enzyme are disrupted and as many weak bonds break, the enzyme's tertiary structure unfolds.
This concludes that increasing the temperature from a low temperature to the optimum temperature decreases the time taken for rennin to coagulate milk and so increases the rate of reaction. Nevertheless, as the temperature ascends above the optimum required, the rennin molecules start to denature and so the time taken to coagulate increases. As a result of this the rate of reaction decreases.
Evaluation
The results seem fairly reliable; conversely the replicates obtained were not always similar to the initial values acquired. At 40ºC, 55ºC and 55ºC, the first readings obtained were quite dissimilar to the replicates. There were substantial differences between these values and the repeats, so these were not involved when the average time was being calculated (these values have been highlighted as anomalies on the results table). To obtain a more accurate rate of reaction, the average time was used to calculate the rate. The anomalies were at 35ºC, 40ºC, 50ºC and 55ºC and there was one anomaly for nearly every temperature measured. The anomalous value at 55ºC was the only anomaly that was higher than its replicates. This may have been because the temperature may have been slightly higher and so, as rennin is an enzyme, it may have denatured a little more. Therefore the ‘lock and key’ mechanism between the substrate and the enzyme would be less effcetive and so the reaction would be slower. Also the time may have been longer owing to the time intervals between measurements. After the test tube had been put in the boiling tube after 15 seconds, it may have started coagulating a few seconds after it had been tested so it would have taken longer for the reaction to be noticed and thus the timing period being adjusted to 10 seconds. Hence, the time would have been longer. In addition to this, there may have been a delay between the time when the test tube was in the water bath to when the rennin was added and the milk may have heated up a few degrees because there may have been some excess hot water left on the test tube as they were not dried. As a result of this, heat may have been transferred from the hot water to the test tube which then have been transferred to the milk this could also be held responsible for the lower anomalies such as those at 35ºC and 40ºCwhich could have been heated, making then closer to the optimum temperature of 45ºC in this experiment. Some of the water my have evaporated in between the time when the time when the test tube was taken out of the water bath to when the bung was placed on the test tube after the rennin had been added. Furthermore, the water on the bottom of the test tube may have evaporated using the heat from the milk which may have reduced the temperature by a few degrees. Therefore, this may have resulted in an increase in kinetic energy which would have led to an increase in the rate of reaction depending on the temperature. The anomaly at 35ºC and 40ºC may have risen a few degrees and so the kinetic energy would be greater resulting in a more rapid rate of reaction. The milk in the anomaly at 50ºC may have been slightly under the actual temperature so the enzyme would be less denatured as it was closer to the optimum temperature. The optimum temperature was at 45ºC which is slightly different to the actual optimum temperature which is about 37ºC – body temperature, but this may have been because of the pH of the milk. Rennin is produced and used in the stomach and so its optimum pH would be about 2 since there is hydrochloric acid in the stomach. However the pH of milk is about 8 as it is slightly alkaline because it contains bicarbonate ions.
If I was able to do this experiment again I would like to make the range of temperatures even smaller, especially by breaking down the range 20°C to 40°C into maybe 5°C intervals. This would enable me to achieve an even more specific and accurate temperature at which rennin works to its optimum and I would do four repeats rather than two so that the average time can be more accurate. I would also keep timing the results that exceed 12 minutes. This method was not extremely reliable as many things could have potentially gone wrong. Firstly, the problem of heat loss or gain could have considerably changed the results by lowering or raising the temperature by a few degrees. Some kind of insulation should have been placed around the test tube constantly. This could have been in the form of cotton wool or bubble wrap. Also the rennin may have cooled down or heated up whilst it was in the beaker owing to the room temperature and the temperature of the rennin at the start (without the milk was never measured). This may have also affected the actual test tubes which contained both the rennin and the milk. Again, to improve this, some form of insulation should be used and the temperature of the rennin should be taken before it is added to the milk. One thermometer had to be used when there were three test tubes in the water bath, so this may have made some of the temperatures of the repeats slightly different. One thermometer per test tube should have been used or perhaps some kind of computer software should have been used.
I would also vary the types of milk used in this experiment. For example full fat, semi skimmed, and skimmed milk could be used and these results can be compared. Also milk from other animals such as goat and buffalo milk can be used. Perhaps even milk such as soy can be tested. The ratio of substrate to enzyme can also be varied as well as the concentration of each substance. To provide extensional evidence for this experiment, different levels of pH should be used, such as the optimum pH that is about 2. This could be achieved by adding acidic or alkaline compounds to the milk. However, at certain levels of ph the rate of reaction (the acidic pHs) would be so fast that it would be too fast to time. Nevertheless, this could be done using computerised equipment. This could also be done in conjunction with varying the temperature.