According to the laws of , different surface temperatures mean different colours (e.g., an iron bar that you heat up, which turns red). Very 'cool' stars on the right of the HR diagram are red; the hottest stars on the left are light blue. The rest are white or yellow.
LC V: Main Sequence
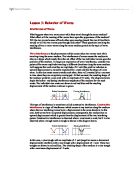
The most obvious feature of the HR diagram is the so-called main sequence. It's a band that goes from the top left to the bottom right and contains 95% of all stars (including our Sun). Above this main sequence you find the giant stars, and below it the dwarfs. Although all main sequence stars belong to luminosity class V by definition, they are very different in luminosity. In fact, the main sequence covers the whole brightness axis. But they do have something in common: they are all very stable and in a phase of their life that can be called 'adult'. In a way, they are the 'normal' stars.
LC I-IV: Giant Stars and Variables
Again the term giant is just a classification. Some main sequence stars are brighter than most giants. However, as far as their expanse is concerned, they can be really big: Y CVn, for example, has a diameter that is more than 1000 times larger than the Sun! A main sequence star of the same brightness would have only 40 Sun diameters. The reason for that is that giants are in the right half of the HR diagram, the cooler half, and cooler stars need a much larger surface to reach the same brightness. This is another law of black body radiation, the Stefan-Boltzmann law.
In the realm of giants you find many variable stars, i.e. stars with variable brightness. There are different types, the two most famous being Mira stars in the M-region (varying in brightness by a factor 600) and the Cepheides (between classes F and G with a very regular light change). The biggest stars are not part of the main sequence, they are really giants. Beta Doradonis (βDor), Rigel or Deneb would easily top 100,000 Suns. However, there are hints that even larger stars exist.
Dwarf Stars
Dwarfs of luminosity class VI play only a minor role in stellar astronomy. But very interesting are the white dwarfs, tiny hot suns in the lower left of the HR diagram. Some of them are only 20,000km in diameter - twice the Earth! Sometimes they form the minor partner in a twin star system, e.g. Sirius or Procyon. This makes it possible to determine their mass quite accurately by measuring the rotational period of the pair.
Stellar Properties
As already mentioned, the HR diagram is spanned by spectral class and absolute brightness. The absolute brightness is directly correlated with luminosity. Although most HR diagram suggests that, the link between spectral class and temperature is not that strong. But for all practical purposes, one certain spectral class yields a certain surface temperature. (The core temperature of the star is something completely different! It lies in the millions of Kelvin’s region.) Due to the laws of black body radiation, a certain temperature and luminosity means a certain star surface. With that a certain radius. So you can add lines of constant radius to the HR diagram. They decrease slightly from left to right.
Every star occupies a distinct position in the HR diagram. If you take the values of very many stars, the resulting HR diagram has a typical pattern. This pattern, however, heavily depends on the selection of stars that you use. Most HR diagrams are based on the brightest stars in the sky, which are mostly giants. A better choice is Earth's nearest neighbours (most of which are invisible to the naked eye). Here giant stars are very rare; in fact it shows that 80% of all stars are less bright than our own Sun.
Different Star Classes
To help systematise star classes, astrophysicists have introduced luminosity classes. There are five or six of them; called LC I-V (or VI) from bright to faint, the first one divided into two sub-classes Ia and Ib. Every luminosity class has a band structure, and their origin is the upper left of the HR diagram.
As a rule of thumb, the mass increases from right to left, but it's impossible to determine it accurately from the position of the star in the HR diagram alone. The heaviest stars have the mass of about 70 Suns, the lightest one fifth of our Sun's mass.
Life of a Star in the HR Diagram
Without giving a complete description of the typical , the HR diagram is a very useful tool if you want to illustrate that. A protostar (stellar baby) approaches the main sequence from the extreme right. (Curiously enough, such baby stars can be larger and brighter than when they reach adulthood.) Then the star occupies a place in the main sequence, according to its mass. There it stays for the biggest part of its life (maybe some 10 billion years, but huge generally don't reach such an age).
Becoming old, the star converts to a giant (red giant). The hydrogen has been almost used up, so Helium has to serve as a (poor) substitute.
Its subsequent fate depends on its mass: normal stars like our Sun shrink to a white dwarf before they remain dark forever. Heavy stars explode as a huge supernova (absolute brightness: about 19M!) and become a neutron star or a black hole. These objects can't be shown in an HR diagram as they have very small radius and non-measurable luminosity.
HR Diagram of a Stellar Cluster
Another useful application of the HR diagram is to include only the stars in a particular stellar cluster, e.g. the Pleiades. If the cluster is young (and the Pleiades are very young), all stars occupy the main sequence. Getting older, more and more stars leave it to become red giants (they wander to the right). This happens at first to the hottest stars in the upper region. So the main sequence gets a 'knee' at a certain point that moves downwards with time. The position of this knee tells the expert the age of the stellar cluster. They say, 'the main sequence is burning down like a candle'.