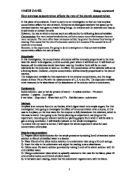
The lock and key theory suggests that the substrate slots into the of the enzyme, and a reaction takes place which turns the substrate into its product. The enzyme remains the same, as it is a catalyst. The product then leaves the enzyme, and the reaction has been successful. The active site is where the process actually happens.
There is an optimum value for lots of things. There is an optimum temperature for enzyme activity - there is an optimum speed for efficient fuel consumption in a car. In the same way, there is an optimum for each and every enzyme. At a pH above this optimum, the enzyme's activity will be reduced and therefore the reaction rate will be lowered; at a pH below this optimum, the enzyme's activity again will be reduced and lower reaction rates result. If the pH increases, this means there are fewer hydrogen ions in solution. This can lead to reactions taking place that alter the functional groups of the amino acids, which in turn leads to the enzyme changing shape. Similarly if the pH decreases, there are more hydrogen ions in solution, leading to the possibility of hydrogen ions causing other group changes. If the functional groups change, the shape will change, and the active site will no longer fit the substrate. This is what happens when pH changes. If the pH is changed sufficiently, the enzyme will be completely altered due to this effect, and it is said to be denatured. However, unlike the effect of extreme heat, which causes the enzyme to be irreparably damaged, denaturation due to pH change is reversible. Restore the pH to its original level, and the enzyme will return to its original capability.
Preliminary Experiment
I did a preliminary experiment to find faults with my actual method and then improve it. This was my method for the preliminary
- Get a spotting tile for each concentration
- Put a drop of iodine into each well on a spotting tile
- Add 1cm³ of the amylase to 5cm³ of starch solution in a well.
- Start stop-watch immediately
- Record you result.
Results of Preliminary Experiment
From the preliminary experiment, I have seen that this method is too complicated and not so accurate because you can tell the exact time when all the starch has broken down.
Method
This is my method for the actually experiment
- Label test tube “Starch”
- Add 10ml of 0.05% to the test tube
- Rinse measuring cylinder and measure 5ml of 1% amylase solution
- Add 2 drops of iodine to starch in test tube, shake gently to mix
- The starch should now be blue black
- Prepare water bath to 25˚c
- Put starch into water bath
- Rinse cylinder
- Add 5ml of amylase
- As soon as you add amylase to start stop-watch
- Time until colourless
- Repeat steps but changing the concentration.
Reliability
In order of the making the experiment as reliable as possible, we will repeat the experiment more the once, at least twice, maybe more depending on time. After repeating the experiment, we will work out an average.
Variables to be controlled
To ensure this experiment is reliable, I will make sure to keep the same factors the same:
- Temperature – I will keep the temperature as equally and the easiest way is to keep it at room temperature
- pH level – The pH level will affect the rate of reaction of the amylase
- Amount of amylase – The more enzyme there is, the more active site are available where the reaction can happen
Our input variable is the substrate concentration and our output variable is the rate of reaction.
Also we will repeat the experiment up to 6 times, because it will make the results more reliable when we average them.
Dilution Tables
To find out what the concentration of the substrate, I will dilute them with water, to the different concentration.
Apparatus
We will be using a range of apparatus to carry out our experiment; I have said why it is being used, and what scale they are in.
Results
Now I know the average time for each substrate concentration. I will this formula to work out the rate of reaction
Rate of Reaction = 1 / time taken
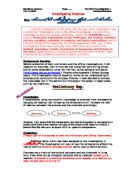
Analysis
From look at the graph, I can see that as the concentration increases, the rate of reaction also increase, but then it starts to round off. In the same way that increasing the temperature increases the chances of a favourable collision, so increasing the substrate concentration increases the chances - because there are simply more substrate molecules. After a certain point increasing the substrate concentration has no effect on the rate of reaction because there are no more active sites for the reaction to happen in .This confirm my prediction as you can see a similarity between the actual graph and the my predicted graph.
From the graph showing the time taken to make the mixture to turn clear, as the concentration increase, the time taken; therefore the rate of reaction increases. We can tell this because the gradient of the line of best-fit is positive. If you add more particles which are able to react, there are more likely to be successful reaction. This is because if you got one particle out of hundred you will have a 1% possibility but of you have 10 particles you will have a 10% possibility of a successful reaction.
The trend of the line of best-fit is, as the concentration increase, so does the rate of reaction. Although my experiment fitted my experiment I have found an anomalous point, for the last concentration. I know this is an anomalous point because the rate of reaction jumps up 0.03 sec-¹, whereas the rate of reaction goes up by 0.01. This anomalous point could be cause by a number of reasons.
Evaluation
I believe that the experiment was success because the result matched my predicted graph because it follows the pattern very well. The experiment was repeated because it would make the result more accurate as well as more reliable, the second lot of results mirrors the first set of results, because the repeat are similar. The range of the repeat are very small, such as the result for 50% only has difference of 1. There are also larger ranges which show that these results are not as reliable as results with difference which have a smaller range. Although I repeated the experiment twice, I found a couple of anomalous result such as the anomalous point on the graph which I had to circle before drawing the line of best-fit. They are anomalous point during the results of the line which represent the concentration of 40%. My graph also shows that the experiment was extremely reliable because if I look at my graph I can see that almost all the points are close to, if not touching the curves of best fits. There are only one point which are quite far from the curves, therefore I have circled them and not included when drawing my line of best-fit. I believe that my experiment was extremely fair because I had control the variable which would affect the results; therefore I keep it as reliable as possible. As the experiment was kept a fair test, I would be able to make a good conclusion. I used a larger range of temperature because it will make the conclusion easier to write because I will be able to see the difference more accurate. If I had enough time, I would use a wider range of temperature also I would test more values.
Accuracy
I think that my experiment was very accurate. The time was to two significant figures and was measured to the nearest second. The volume of gas was between one and three significant figures and was measured to the nearest centimetre cubed. The temperature was to two significant figures and was to the nearest degree centigrade. The divisions on the thermometer were one degree apart whilst the divisions on the gas syringe were of 1 cm cubed. The measuring cylinders had divisions of 1 cm cubed. The equipment used to measure was very accurate.
I could make my experiment more accurate by using much more accurate equipment. I could use a burette to ensure that my measurements for the starch and water were even more accurate.
Problems and Solutions
Conclusion
In conclusion, I feel that this experiment went successful, as it did everything as it answered the question ‘How does the concentration of the substrate affect the rate of reaction between Amylase and Starch Solution’. I can answer that by showing them the two graphs as well as the result tables, and by saying
As the concentration of substrate increase, so does the rate of reaction