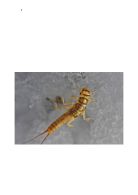
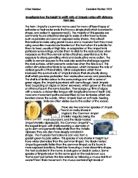
Stonefly larvae’s adaptations include a long and thin body so they are hydrodynamic in fast flowing streams. Hooked claws on there feet so they can cling to the substrate of their habitat even when the water is flowing really fast. Gills that give a large surface area for diffusion of oxygen into there bodies. [6]
Invertebrates like stonefly larvae need to filter oxygen from the water for use in aerobic respiration. Aerobic respiration may be represented by the general equation: C6H12O6 + 6O2 6CO2 + 6H2O. About 3000 kJ mol-1 of energy is released. Burning glucose in air would release this amount of energy in one go. However, it is not as simple as this in aerobic respiration. Aerobic respiration is a series of enzyme-controlled reactions that release the energy stored up in carbohydrates and make it available to living organisms. [5] Stonefly larvae are small enough so that they have a surface are to volume ratio which would allow them to diffuse oxygen into there bodies without the use of a specialised organ, however they live under water so they have specialised gills on there body which have a large surface area so when oxygenated water flows over them they absorb some of the oxygen that they can use for respiration.
Rationale
This experiment studies the affect of oxygen concentrations in water on aquatic life, mainly invertebrates. Therefore the results will help in understanding how pollution affects the growth and life cycles of aquatic animals. With increased research into this subject methods of preventing or treating polluted water can be found to increase biodiversity in rivers and streams. This will be beneficial to the fishing industries as the increase in aquatic life means an increase in fish.
Initial Planning
The independent variable I will be monitoring in my research is the amount of oxygen dissolved in the water. I will take readings in many different places as to get a wide range of oxygen readings. The dependant variable I will be measuring is the amount of stonefly larvae in an area, I will see if this number is affected by the independent variable. There are lots of control variables I need to think about. As this research is conducted in the field it is very hard to control some variable. I plan on taking as many measurements as I can but I need to think about where I will take them. I will take my measurements in places where there is little tree cover so that there is allot of light in the area. I will also make sure the substrate is the same where I take measurements as it could affect my experiment allot, I will do this by picking places with the same sized rocks to take my measurements. Depth is another variable I will need to control, I will do this by measuring in places of roughly the same depth. Temperature and speed of the water are the hardest variables to control as they fluctuate in the different parts of the stream. I will measure these variables in my trial investigation to see what kind of affect they have on my dependent variable.
Initial Method:
Choose a suitable place to take measurements taking into effect the light and substrate
Measure the depth of water with a meter ruler and record
Measure the temperature with a thermometer of water and record
Measure the oxygen dissolved in the water and record
Take a D net sample by kicking up the substrate for 20 seconds
Count number of stonefly larvae in tray
Return the sample to where you found it and repeat
Preliminary Results:
Risk Assessment
Revised plan
I have arranged my preliminary results into scatter graphs to get a better view of how the different variables affect the dependant variable. Depth does not seem to have much of an affect on the number of stonefly at a site, there is no correlation in the scatter graph and the results are spread out so not very precise. This means I will need to control depth but not as carefully as other variables. Temperature does not seem to have much of an effect on the number of stonefly either, but I think this is because the temperature does not change much over the different sites I took samples from. This means I will need to control the temperature but not as much as other variables. Velocity of the water against number of stonefly larvae seems to have a positive correlation but not a very precise scatter. This means that velocity can affect the number of stonefly larvae at a site so I will need to control this variable as much as I can.
I have decided to make many changes to my initial method of research. I have decided not to measure the depth or temperature of the water, as there is not a large enough range to affect my dependent variable. I will be controlling depth by only choosing places that are around the same depth but I will only measure this using my eyes. I have decided this because of the data I have gathered in my preliminary data. The temperature of the river I am taking my measurements in hardly changes and does not affect my dependent variable in my preliminary data. I will need a more precise stopwatch for taking velocity measurements as I want the data to be as accurate as possible and the stopwatch I was using only gave an inaccurate reading. I am changing the amount of time I will kick the substrate for when taking a D-net sample. It was originally for 20 seconds but I am changing it to 10 kicks, as I will get more accurate results. This is because in 20 seconds you could be kicking at a different tempo and do a different number of kicks at one site compared to another, doing 10 kicks solves this problem as it doesn’t matter how long you take it will always be the same amount of kicks. Another thing I am changing about my initial method is the order of which I take measurements. Originally I measured depth, O2 level, temperature and velocity before I took the D-net sample. This was bad as taking the measurements before the D-net sample could have disturbed the stonefly causing inaccurate results when I counted the sample. I have changed the order to D-net sample first then speed and finally oxygen levels as this makes the measurements allot more accurate. The final change I will make to my method is to repeat the measurements I conducted a number of times so that I will get a nice average measurement for each site, which will make my results more precise.
Apparatus needed:
- D-net to take samples of invertebrates
- White tray to store samples in for easy counting
- Identification key for identifying invertebrates
- Oxygen meter for measure amount of dissolved oxygen
- Meter ruler for measuring velocity
- Tennis ball for measuring velocity
- Precise stopwatch for measuring velocity
Method:
Find a suitable location (site) to take measurements where there is no shading, the right depth (you can stand in it with water just at your knees) and has the right kind of substrate (medium sized rocks) in it. The site must be large enough to take a few different samples without sampling places you have already been.
Take a D-net sample by kicking the substrate hardly 10 times upstream of the net to dislodge any invertebrates and send them into the net.
Place the D-net sample in a white tray and count the number of stonefly larvae using a key to identify them then release them back where you found them.
Repeat this step 3 times at different places in the site and record the number of stonefly larvae.
Take dissolved oxygen levels using the oxygen meter and record the results, repeat two more times in the places you took the D-net samples from.
Use the meter ruler, tennis ball and stopwatch to record velocity of the water by recording the amount of time taken for the ball to travel 1 meter in the river. Repeat 2 more times.
Observing And Recording
Anomalous Results:
The anomalous results in my data are highlighted in yellow on my results table. Both of the anomalies appeared when counting the number of stonefly larvae in a sample. The simple answer for these anomalous results is that I took the samples wrong or miscounted so it was human error. For site 8 the number of stonefly larvae counted in one sample is allot higher then the other two, I may have recounted the same stonefly larvae by mistake. For site 12 it is a lot lower, I may not have taken the D-net sample properly for example only kicking 5 times instead of the required 10 times.
I did not use these anomalous results to calculate the mean amount for each site as I felt it would give me unreliable results. Instead I just used the other two sample numbers from each site.
This graph shows a definite trend and a positive gradient. As the oxygen levels of the water goes up so does the amount of stonefly larvae found there.
There does not seem to be a trend or gradient in this graph, the scatter is very large and the data is spread out so not very precise.
Interpreting And Evaluation
Spearman’s Rank Test
Coefficient = 1 – 6(ΣD^2) ÷ n(n^2 – 1)
ΣD^2 = 792
n(n^2 – 1) = 30(30^2 – 1)
1 – (6*729) ÷ 30*899
1 – 0.176199
= 0.823801
Experimental Hypothesis
I expect there to be more stonefly larvae in water with a high concentration of oxygen compared with water of a lower concentration of oxygen. This means that there would be a positive correlation between water oxygen levels and number of stonefly larvae. The test would give a value close to 1.
Null Hypothesis
There is no correlation between water oxygen levels and number of stonefly larvae. The test will give a value close to 0.
Critical Value
Using a spearman’s rank correlation coefficient table I have tested my null hypothesis and experimental hypothesis to chose which to accept and which to reject. At a 5% confidence level with 30 pairs of data (n) if the value is equal or higher then 0.364 I will reject the null hypothesis and accept the experimental hypothesis. The result from my spearman’s rank test is 0.824 which is larger then 0.364 so I am going to reject my null hypothesis and accept my experimental hypothesis.
Data Analysis
The results of the spearman’s rank test shows that stonefly larvae prefer to live in areas with the highest % of oxygen in the water. This is because the coefficient I got was a lot higher for the critical value at 30 pairs. Therefore there is less then 5% chance that the results happened due to chance and over 95% chance that they are correct. This indicates my experimental hypothesis is correct. So in conclusion I accept my experimental hypothesis.
Graph one shows amount of individual stonefly larvae against the oxygen level of the water. The graph shows that the higher the percentage of oxygen in the water, the more stonefly larvae there are in it. This is because the stonefly larvae need a high concentration of oxygen in the water for them to get enough oxygen via diffusion into their gills to aerobically respire to produce energy. They need the energy they produce for many different living processes. Stonefly larvae have two sets of gills, which have a very large surface area when combined together. The reason these gills need such a large surface area is to absorb oxygen in the water, but if there is not much oxygen in the water the stonefly will not be able to absorb enough of it. Stonefly larvae will only live in an area if it has enough oxygen and they prefer healthy oxygenated waters.
Graph two shows the amount of individual stonefly against the speed of the water flow. I included this graph in my results because I could not control the variable very well and I wanted to see if it would affect my hypothesis. The results of the graph do not seem to affect my hypothesis, as there is no correlation between the two sets of data. This means that stonefly are not directly affected by the speed of the water around them.
Evaluation
There where allot of variables I could not control because my research was carried out in a natural and unpredictable environment. The main limitations to my data was that I could not control the substrate of the site in the river where I took my sample, the rocks I tested on could have been slightly smaller or larger and there could have been a different amount each time. This could have caused random errors. Another limitation is that when you kicked the substrate 10 times to take a D-net sample you could not be sure to kick with the same strength each time, kicking harder would release more invertebrates from the stones, kicking weaker wouldn’t release as many. This also could have caused random errors. Overall variables where kept as constant as possible and the limitations to my data would not have affected my results too badly as they where small limitations (ignoring the occasional anomalous result). I repeated measurements often so this helped reduce the risk of random error significantly and the large number of samples I took gave enough replicates to support my conclusion. Therefore I believe my experiment was controlled well, the results reliable with a low degree of error and supports my conclusion well.
I could improve my experiment by controlling the variables more precisely. I could do this by finding and marking multiple sites with as similar conditions as possible (depth, temperature, velocity) and then taking net samples at a later date. You would have to come back at a later date to take D-net samples as taking the measurements of the variables could disturb the invertebrates leading to unreliable results. You would need to conduct the research over a larger stretch of river to get enough data and mark the sites you would use in a way that would not have an affect on invertebrates in the area. This was not possible during my research, as I did not have the time.
References:
Journal:
Nebeker V. (2011), Transactions of the American Fisheries Society, Effect of Low Oxygen Concentration on Survival and Emergence of Aquatic Insects, 141(6), 675 – 679 [1]
This source of information is very reliable and holds a lot of interesting and useful material to help me with my research. This source is very reliable as it is a widely viewed scientific journal that has been checked by the scientific community before it was released.
Books:
Whitten T. Damanic S. (2000) Adaptions of aquatic invertebrates Johansen S. (ed.) The Ecology Of Sumatra 115 – 155 Publisher: Eric Oey [6]
This book is a good source of information is reliable. It has a lot of interesting and useful information inside of it. This source is reliable as it has been written, published and edited by well known people.
Websites:
Oxygenated water: [2]
Lenntech water Treatment Solutions (2002)
Accessed on 12th August 2012
This website was a good source of information on oxygen in water however it is not reliable as it could be bias. The company who have made the website might want people to believe there views on oxygen in water.
Stonefly larvae: [3]
Chesapeake and Costal Sea Life (2001)
Accessed on 11th August 2012
This website helped me learn more about stoneflies but was not reliable as it is very informal and unscientific.
Stonefly larvae: [4]
Eco Spark (2010)
Accessed on August 12th 2012
This website was very helpful for learning about stonefly larvae and there adaptations and I think it is reliable as it is new and lists its own reliable sources well.
Respiration: [5]
Chemistry For Biologists (2004)
Accessed on August 12th 2012
I used this website for information on respiration and it was very useful. The website is a reliable source as it is very scientific and formal.