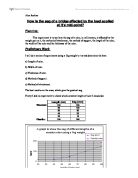
This graph shows me that using one ruler thickness will give me the best results.
I can now decide on the thickness of the ruler to use by putting two or more rulers on top of each other to get different thicknesses:
From this graph I can see that I need to use only one ruler to get the best results.
I now need to find out the best method of support, either using G clamps or resting on stools:
This graph shows that resting the ruler on two stools is the best method of attachment.
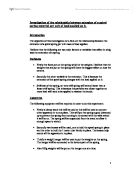
Finally, I need to find out the best method of attachment, either on top of the rulers or hanging underneath:
This graph shows me that hanging the weight underneath will give me the best results.
Key factors to vary and keep constant:
Now that I have figured out which apparatus to use, I can now work out what key factors I need to vary and keep constant.
Things to vary:
Load (N). (+100g per reading)
Things to keep constant:
The length of the ruler, (100cm)
The width of the ruler, (1 ruler width)
The thickness of the ruler, (1 ruler thickness)
The method of support, (resting on two stools)
The method of attachment. (Hanging under the ruler)
Method and equipment:
Diagram:
Method and Equipment:
I set up the experiment as shown in the diagram. I will measure the initial height of the ruler and then take readings from the top of the ruler when it sags.
I will then add 100g onto the weight and take the next reading from the original position. After I have added 1kg and taken the measurements, I will then start unloading the weights and taking measurements for unloading as well to see if there is much change. I also need to take into account that the ruler weighs a certain amount as well, which needs to be implemented into my results.
Number and range of measurements:
I will take ten readings, starting from 100g going up to 1kg (1000g) adding 100g each time. I will then unload the weights and take the measurements again. I will then turn the ruler over and repeat the process. After I have all the results, I will take an average of each measurement by adding them all together and dividing by four.
Scientific Knowledge:
Total load = weights + weight of ruler
Weight of ruler = 0.445g
Therefore I must add 0.445 to each of my results.
The forces between the molecules behave like springs:
Elastic deformation:
Inelastic deformation:
After the initial set of results, I will then turn the ruler over and take another set of results.
This way it is easier to get the average of the results.
L = length
B = breadth
D = thickness
E = modules of elasticity/
Youngs modules
Results:
After completing the experiment I recorded my results in a result table:
I then made a graph of the average sag against the load:
Evaluating evidence:
After checking through my results, I can see that the load is not directly proportional to the sag because the line of best fit is not a straight line through the origin. This may be because the accuracy of the ruler used to measure the sag was measured to 1 millimeter. This means that there will be a small margin of error for each reading. The uncertainty also shows that the readings have a small margin of error. The apparatus was set up in a way in which the sag could not be measured accurately as when the load was too great, the ends of the ruler had to be held in order to stop the ruler from slipping off the stools. This will have affected the results.