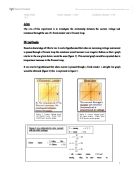
In this experiment we had to investigate how the power dissipation of a filament lamp varied with different potential differences across the circuit.
Experiment to find the relationship between power
Applied and potential difference
Introduction
In this experiment we had to investigate how the power dissipation of a filament lamp varied with different potential differences across the circuit. Also to find a relationship between the power and potential difference, from this information draw a graph and collect suitable results.
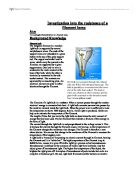
Method
I connected a power supply to a filament lamp (10v maximum output) this was then connected to an amp meter this was then connected back to the power supply. The voltmeter was connected in parallel.