Incidence of Thyroid Cancer in Belarus
Incidence of Thyroid Cancer in Belarus Rebecca Newiss
Biology Coursework 11O2
Belarus is a region just north of the Ukraine in an area that was previously part of the Soviet Union. In 1986 the nuclear reactor at the Chernobyl suffered a serious incident involving a fire and the release of significant amounts of radioactivity. The Gomel region lies immediately to the north of Chernobyl and is known to have received a high level of radioactivity as fallout after the breakdown of the reactor on 26th April 1986. The plume passed first over the Gomel region in the first few hours after a major release of radioactivity, and then over the Brest and Grodno regions. The fall out contained large amounts of iodine - 131. The 'cloud' of radioactivity then moved west over Northern Europe and eventually the U.K. The incidence of thyroid cancers has been monitored in many of town s in Belarus that the town passed over. Here were their findings.
Town
Years
986
987
988
989
990
991
992*
Total
Brest
0
0
6
5
5
8
Vitebask
0
0
0
0
3
0
4
Gomel
2
2
4
38
3
71
Minsk
0
0
0
5
2
9
Mozyr
0
2
2
30
2
58
Mogilev
0
0
0
0
2
4
Zlobin
0
2
1
24
9
48
Bobrusk
0
0
0
3
5
3
6
27
* First six months only
From this data and the map I was given then began to investigate the relationship between the incidence of the thyroid cancer in children and the distance from Chernobyl. To do this I drew the table below, I measured in millimeters the distance between Chernobyl and the towns given. I then, by using the scale on the graph, found out how many kilometers were equal to one millimeter, I knew 50km was equal to 15nn, therefore I divided 50 by 15 and found that there were 3.3km to every mm. I then converted all my distances in millimeters in to distances in kilometers.
Town Name
Distance in mm
Distance in Km (rounded to a whole number)
Number of cancers in the town
Brest
35
446
8
Vitebask
28
422
4
Gomel
42
39
71
Minsk
00
330
9
Mozyr
33
09
58
Mogilev
87
287
4
Zlobin
53
75
48
Bobrusk
65
215
37
I have then taken this information and presented it as a scatter graph, please see the attached graph; I have also added a line of best fit to show the correlation and trends of ...
This is a preview of the whole essay
Brest
35
446
8
Vitebask
28
422
4
Gomel
42
39
71
Minsk
00
330
9
Mozyr
33
09
58
Mogilev
87
287
4
Zlobin
53
75
48
Bobrusk
65
215
37
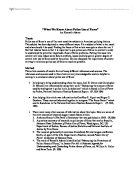
I have then taken this information and presented it as a scatter graph, please see the attached graph; I have also added a line of best fit to show the correlation and trends of the graph. The data I have plotted on the graph I have noticed forms a smooth curve. The graph is at its highest peak at the beginning, this just happens to be above 140km mark from Chernobyl, as the distance from Chernobyl increases, the number of cancers decreases, this causes the graph to form a straight line in a negative fashion, although at the bottom of the graph it curves slightly, this point is directly above the 422km mark from Chernobyl.
I feel the graph has taken this pattern, the further from Chernobyl the places become, the fewer cancers they have, this I feel is due to the concentration of the radioactive 'cloud' that passed over the towns. As the accident happened the cloud would have been extremely concentrated, as it would not have had time to disperse, therefore resulting in an overwhelming amount of cancers in the future, unfortunately we are not given this figure. The radioactive cloud would have then dispersed a little and then moved by winds, it then traveled over the neighboring towns of Gomel and Mozyr, as the cloud disperses the concentration will have decreased due to the radioactive particles mixing with the particles in the air. Therefore the number of cancers will be lower than the number of cancers in Chernobyl. The cloud will mix with more air particles and will influence it to grow but also become less concentrated, as it grows it will cover a larger area as it will be moved by winds, therefore the cloud will soon reach towns such as Zlobin and Bobrusk. The much less concentrated cloud will eventually reach the remaining towns; the number of cancers related to the incident will therefore depend on the distance the town was from the incident site, Chernobyl.
Evaluation
There are three pieces of data, that are clearly labeled on my graph, that I agree do not fit the pattern my graph follows, these are; Mozyr, I think this one is an anomalous results as it falls too far away from the line of best fit. The number of cancers the town had was fifty eight, in comparison to the distance from the town this number was too low as the town Gomel, which was 30km more away from the incident site had seventy one cancers. I know that the number of cancers for Gomel is correct as it follows the line of best fit and also ties in with all the other results. Mozyr should have had around 90 cancers not fifty-eight. The second anomalous result was the town Mogilev; this had 4 cancers and was 287km away from Chernobyl, this result is also falls far away from the fine of best fit and is too low as the number of cancers should be much higher, around 17. The third and final anomalous result is for the town of Brest; this particular result shows that the number of cancers here is much too high for the distance it is away from Chernobyl, the result should have been around 3 or 4, instead it was a massive 17.
I feel that these three particular points do not fit the pattern because of a number of issues, firstly the weather. The wind I feel could have been blowing in a direction that favored particular towns more so than others, this idea could explain why the town of Brest had such a high number of cancers, the wind could have been blowing in a westerly direction. Although it could be the same reason why Gomel had a higher number of cancers than Mozyr even though Gomel is 30km more away. The wind could have been going northeasterly. There could have also been errors in the collection of the data as the investigators could have also taken into account outlying areas, which would give a higher population of people to investigate, if they did this for some towns and not others they may find that people living in the outlying areas were closer to Chernobyl and therefore more at risk and a higher number of cancers would have occurred.
There were many short-lived isotopes of iodine in the fallout from the cloud, many people could have still got cancer from these, but because they were short-lived it may not have been obvious or traceable that the people had got cancer from the radioactive cloud, the doctors could have easily put it down to another cause such as secondary smoking. If this was the case, people with cancer that has developed in this way, from the accident, but have been confirmed that it had occurred from another cause, would not have been registered in this survey, therefore the amount of cancers from these towns would have ultimately been lower, this could be the reason why Mogilev and Mozyr's results were lower than expected.
The number of cancers could have also been affected by the towns geographical location, if the town was on the top of a hill or had higher latitude then the people living here would be subject to more radioactivity, if they were they would have had more chance of getting thyroid cancer, this could be the reason why Brest had a large number of cancers. The graph could have been different if the investigators had registered all the cancers of 1992 and not just the first six months, this could have risen many of the totals, this factor would have had an affect on the total result gained, therefore all of our results are not correct, the graph could have also be different in shape.
I believe that the data is sufficient to say that generally the further from Chernobyl a town becomes the less cancers will be found there, but I don't feel the data is reliable enough to give a firm and definite conclusion. I think this because we do not have all the results for all the years; we are missing the results of the last half of 1992. This has then caused a difference in results, as they are insufficient, this then might have caused the three anomalous results. Also I don't feel that the results are that reliable even though the majority followed an obvious pattern, I think this because out of 8 results 3 are wrong, I feel there have been mistakes made. Therefore I agree that more towns should have been analysed, this would have given more results and a more reliable and obvious pattern would have been formed, it is not conclusive enough that only 5 towns fitted a pattern, there were more towns in the area and I personally think these should have been investigated too. Also I think that the population size of the children in these towns could have affected the results, it was not taken into account that some towns were larger than others, therefore larger populated towns will have more cancers, the distance from Chernobyl will have little affect on this number.
To further the evidence collected that the children have got the cancer due to the Chernobyl accident I could look at their DNA for mutations. Mutations are changes in the DNA structure and are caused when individuals are exposed to mutagenic agents; an example of these is radioactive substances. We already know that the accident at Chernobyl released radioactive substances into the atmosphere that were then breathed in by the people in surrounding towns, I also know that if I greater the dose of radioactivity the greater the risk. This theory would then explain why towns closer to Chernobyl had a higher number of cancers. By looking at the structure of a DNA molecule I would know ones that had been subject to mutation would have resulted in a new form of gene, the ones that were not subjected to mutation would have the original genes. These changes can then be passed onto 'daughter' cells as a result of cell division, in other words the organization of part of the DNA molecule would be disturbed, which would result in the cell producing different sequences of amino acids and therefore proteins. Therefore, we can compare the proteins in the people who have thought to have been subjected to radioactivity and those who have thought not, if the proteins are different then we know that it is the radioactivity that has caused this, therefore the authorities should accept responsibility.
Rebecca Newiss