Procedure – add 5cm of starch to each of two test tubes. After putting the diastase in a water trough through the different temperatures, add it to the starch solution. Then add iodine. Leave overnight for best results. See what colour it has turned to. temperature 14¦ C Time in minutes colour 1st experiment colour 2nd experiment
0 black black
0.30 black black
1 black black
1.30 black black
2 black black
2.30 black black
3 black black
3.30 black black
4 black black
4.30 black black
5 black black
5.30 black black
6 black black
6.30 black black
7 black black
7.30 black black
8 black black
8.30 black black
9 black black
9.30 black black
10 black/brown black/brown
10.30 black/brown black/brown
11 black/brown black/brown
11.30 black/brown brown
12 brown brown
But I will only do the most significant ones 25|c 40 and 60 My graph shows that I have no anomalous results and they all follow a smooth curve My graph shows that there is an optimum temperature . The first graph is a curve with all points in a place I would expect them to be.
OBSERVATION
As we can see, the blue- black solution representing the digestion of starch. All the others turned purple- black solution showing that the optimum is 40.
So it supports the theory that states that an enzymes function at an optimum of 40
As we can see from the graph it proves my hypothesis that the optimum of diastase as like most other enzymes function at 40 also we can notice that at 60 it begins to dysfunction and then denaturing occurs.
So therefore my hypothesis is true. Analysis.
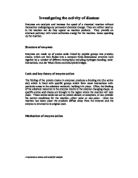
My first graph shows the time taken for the amylase to break down the starch at a range of temperatures.
The graph is a curve showing that at 14¦ C the breakdown of starch to take 11.30 min and 37¦ C to be the optimum temperature taking 0.35 minutes to breakdown the starch, after this temperature the enzyme is denatured. The proteins structure unravels, which changes the shape of the molecule, and exposes the inner cells of the protein to the killing temperature. The gradient shows that the enzyme is not working as efficiently as it could and therefore needs a greater amount of time to breakdown the starch.
This supports my prediction that diastase works best at temperatures slightly below 40¦ C. My graph showing the rate of reaction between the starch and the amylase shows that as the temperature increases to 40¦ C the rate of reaction also increases and that as the temperature increases above 40¦ C the rate of reaction will decrease rapidly.
The peak in the rate of reaction is 37¦ C which is the best temperature for efficient use of diastase. The reason for the decrease in rate of reaction after 37¦ C is the enzyme is damaged.
CONCLUSION AND EVALUATION
In conclusion I think my experiment worked out well according to plan and I think this proves the theory beyond every reasonable doubt that Diastase is an enzyme like others exhibiting different effects under change in temperature.
Also that it has an optimum of 40 and denatures at temperatures exceeding that 40 which is the maximum and the highest the enzyme would function at
My results proved my prediction to be correct. The breakdown of starch is quicker as the temperature increases until the optimum temperature after which it begins to slow down.
I think my results were sufficient to support a firm conclusion, but if I had the chance to investigate further the effect of temperature on the breakdown of starch I would take more results focusing on the higher temperatures and try to pinpoint the optimum temperature.