Velocity =VM (S)
KM+(S)
I found the value of (S) by calculating the amount of moles per litre using the relative molecular mass of water and hydrogen peroxide and the Avogadro constant. This was between 0 and 6 moles per litre for the concentrations between 0% and 20%.
Therefore V=1012*5
5E-8+5
V=1E12 reactions per second per molecule of enzyme. wwef efw esefefs ayef efba nef kcef efuk.
I estimate that there are about 50000 molecules of enzyme per square centimetre. If each cylinder has a surface area of 4 square centimetres the total amount of molecules of enzyme is 1.2E6.
1E12*1.2E6=1.2E18 reactions per second.
Each mole (6.02*1023 molecules) of oxygen takes up 24 litres.
(1.2E18/6.02E23)*24,000=0.05ml/s.
Safety: during this experiment, gloves and goggles must be worn has hydrogen peroxide is corrosive and irritant. Any spillages must be wiped up as soon as possible to avoid accidents and mishaps that could be caused by leaving them.
Apparatus: Diagram of apparatus:
· · ½ litre container
· · Boiling tubes
· · Five litre ice-cream
tub
· · Retort stand
· · Three clamps
· · Buckner flask (with wwdb dbw esdbdbs aydb dbba ndb kcdb dbuk;
tube and bung)
· · Stop clock
· · Pipette
· · Burette
Instructions:
1. 1. Prepare boiling tubes, each with 25 ml of hydrogen peroxide in them (only prepare as many as will be used on that day). Prepare solutions of 20%, 17.5 %, 15%, 12.5%, 10%, 7.5%, 5%, 2.5% and 0%. There should be three test tubes of each concentration for the repeats.
This should give a decent range and adequate repeats to come to a conclusion. I decided that boiling tubes are the easiest way to keep the solutions until in use because they can easily be labeled and kept in a rack. Although only slowly, hydrogen peroxide still decays in the absence of a catalyst (even in a fridge). This could affect the results.
2. 2. Set the apparatus up in the way shown above, making sure that no (or as little as possible) air leaks into the burette when it is inverted with the open end underwater.
Clamping the apparatus in place enables me to concentrate on running the experiment and not have to hold anything.
3. 3. The tube must be fixed under the burette, with a funnel directing the air bubbles into the burette.
It is also possible to do it without a funnel. The funnel is to prevent the pressure of the air being pushed into the burette from causing the pipe to pop off or oxygen to be leaked from the system (squeezed out). Any pressure build up could also lead to inaccuracies. wAPRn Visit essaybank cf co cf uk cf for more cf Do not cf redistribute wAPRn
4. 4. The burette must only have the part of it with no scale underwater (so that a maximum amount of gas can be collected to reduce the percentage error).
The gas could have also been collected in a gas syringe or over water in a measuring cylinder, but the latter is not as accurate as a burette because of the smaller graduations and larger distance between the outside and the centre of the meniscus and the former is not as reliable as a burette because of the friction in the system causing pressure and possible leaks to affect the results.
5. 5. The tube that carries oxygen to the burette must be put into the water in such a way that no air is trapped underwater that could rise into the burette to spoil the set up or the results.
This is worth doing because if a bubble goes into the burette before the experiment starts it is very annoying to have to get the waterline back to 50 ml.
6. 6. When this is all ready, prepare five 1-cm-long cylinders of potato, using borer size 4. Make sure that there are no skins on the cylinders.
1. There is no point in having fast reactions if the percentage inaccuracies in timing, caused by the short times and the percentage inaccuracies in surface area caused by cutting the potatoes into very small pieces by hand (a variation of about 0.5 mm either side), are so large that the results are inconsistent. However, too slow a rate, however low the percentage inaccuracies may be, is impractical, as I do not have all the year to do this in. I therefore decided on cylinders of 1 cm length made with a fairly thin borer1. (size 4) so that the circumference was constant (and small enough to give the cylinders a large enough surface area) and the inaccuracy was reduced (1 mm in 10=10%). Trying this out, I realised that the inaccuracy was still much greater than I would have liked it to be. I therefore weighed them too, to insure that all the pieces of potato had the same mass. This gives them the same volumes (presuming that the variations in density, caused by a gradual water loss by osmosis and the retention of the shape of the cells by the cell wall, are negligible) and therefore, if the pieces are flat ended cylinders of equal radius, the same surface area. The scales/balance weighed to an accuracy of one hundredth of a gram. My pieces were 0.5g. The inaccuracy was therefore 0.01/0.5 =2%, 1/5th of what it would be without the scales. Skin on the cylinders must be avoided because this would have a large effect on the surface area. wwdb dbw esdbdbs aydb dbba ndb kcdb dbuk:
7. 7. Then pour the first 20 ml of hydrogen peroxide into the conical flask and start the stop clock as the bung goes into the flask.
I decided to use 20 ml because I thought that this seemed about the right amount and 20 would divide easily to dilute the hydrogen peroxide. A stop clock is most suitable because it is accurate and can easily be stopped and started without looking at it.
8. 8. After five minutes enter the amount of gas collected in the burette on the table, making sure that this point is at eye level to eliminate parallax error.
I decided to collect as much gas as possible if I had time, because this would reduce the percentage errors. If the point on the burette is not at eye level, the thickness of the burette and distance to the centre of the meniscus could throw the measurements out.
9. 9. Stop the stop clock as soon as the burette is full of gas (again, make sure that this point is at eye level to eliminate parallax error). The stop clock should be stopped the moment the bubble reaches the surface. wwea eaw eseaeas ayea eaba nea kcea eauk:
The moment that the bubble reaches the surface of the column of water in the Burette is better than their moment at which it comes into the Burette because one the can see it rising in that the Burette and get ready to stop the stop clock.
10. 10. Enter this time and the temperature of the solution in the Buckner flask, together with the corresponding concentration and in the correct column for which repetition of the experiment it is on the table.
I decided to take the temperature of the reactants, because this is the temperature at which the reaction occurs, and the temperature affects the rate of the reaction. I could then use the Q10 formula to “temperature balance” the results.
11. 11. Repeat the experiment three times for each concentration of hydrogen peroxide.
As I have said earlier, the more repetitions the better, and if they are not done on the same day as each other, all the better to prevent factors like which potatoes I was using and draught in the lab from affecting my average results.
For one of the reactions, take readings of the amount of gas in the burette every 30 seconds. This is to show the activity decrease curve throughout the individual reactions.
This is a summary of the steps that and I will take to reduce the amounts of errors affecting the results.
· · Keep the level of water in the ice cream tub the same and the retort stand with all the clamps and the funnel on it to make sure that the oxygen has the same distance to travel underwater each time.
· · Use a burette (reasons already explained in plan).
· · Use a compromise between factors (e.g. large volumes/longer times) to reduce percentage inaccuracies where possible.
· · Record the temperature of the hydrogen peroxide, so that I can use the Q10 formula to temperature balance the results.
· · Repeat each experiment 3 times to get an average.
· · Keep the time that I collect for (five minutes) and amount which I collect (20 ml) there same so that the reactions are at the same stage in their natural exponential decay curve when the measurements are taken.
· · Use potatoes from the same batch for all of the reactions.
This coursework from
This is what I will do with my results and how I will record and process them.
· · This is the table in which I will record my observations.
I will then: wwef efw esefefs ayef efba nef kcef efuk.
· · Plot a graph of rate against (average) substrate concentration and compare it with the prediction.
· · Calculate the amount of enzyme present and compare this with the prediction.
· · Calculate the Michaelis constant (KM) for catalase.
· · Decide whether the Q10 Formula is accurate for catalase.
· · Plot a graph of rate against concentration with all the repeats and the averages on and determine from the line of best fit which results were anomalous.
· · Decide what factor might have caused the anomalies
There are many variables that affect the results and a fluctuation of any of those that I am controlling will result in incorrect, biased or anomalous results.
The factors that are most likely to cause inaccuracies are:
· · The accuracy to which I can dilute the hydrogen peroxide, including; drips, pipettes leaving different amounts in the tip, parallax error (minimal), gradual breakdown of the hydrogen peroxide and impurities in the beaker including water (after being washed out).
· · The accuracy to which I can control the surface area of potato exposed to the hydrogen peroxide including; the accuracy of the scales, water on the potato cylinders, the temperature in the room (the borer expands with a rise in temperature, affecting the size of the cylinders), although only a minor consideration, the way in which I trim the cylinders to have the same weight and the density of the potatoes (which could change due to incipient plasmolysis).
· · Fluctuations in the precise set-up of the apparatus, including the depth of the water in the ice-cream tub (against which affects the pressure which the oxygen has to push), the relative heights of the beaker and the bottom of the burette and the air pressure on the day.
· · The accuracy of the measurements including; the time lapse between seeing a bubble get to the surface of the water in the burette and stopping the stop clock and the size of the bubble (a large one could mean a jump from too little air in the burette to too much air, resulting in the timing being out).
· · The accuracy to which I can measure the temperature, the time lapse between finishing the reaction and taking the measurement possibly being significant because the reaction is endothermic and the hydrogen peroxide is kept in the fridge, therefore the solution will get warmer the longer one leaves it until it is at room temperature. The thermometers to which I will have access are also not very accurate. from www.essaybank.co.uk
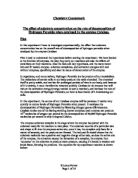
In this section I have given the reasons for any modifications on the original plan that were necessary during the execution of the experiment.
· · I had originally planned to use 20 ml of catalase solution. I found that this was too slow and therefore the inaccuracies would be magnified and the results vary greatly for the lower concentrations. I therefore increased to 30 ml.
· · I found that some of the results were out, so I decided to leave out the experiments at 2.5% and 7.5%, and repeat the experiments for the one that was out (i.e. 12.5%).
· · This still gave me a fairly large range, and the extra repetition helped to define the trend in places where it was not so clear.
· · When setting the apparatus up, I found that the rubber parts of the pipette could be used to suck water up the burette. This meant that the set up could be left exactly as it was and only the flask had to be removed from the set up to rinse out.
· · I also left the apparatus set up when I had finished, and used the same retort stand with everything already on it each lesson, which saved time and reduced inaccuracies.
· · I found that collecting 20 ml instead of the originally planned 50 still gave me fairly low percentage errors, and reduced errors caused by the natural curve of a reaction causing times to be exaggerated at lower concentrations. wwff ffw esffffs ayff ffba nff kcff ffuk;
· · I had 2 retort stands set up, which saved time and let me do some shorter reactions whilst a longer one was going on.
I think that the errors which affected my results, in order of importance, were:
· · The accuracy to which I could dilute the hydrogen peroxide, including drips, pipettes leaving different amounts in the tip, parallax error (minimal), gradual breakdown of the hydrogen peroxide when I used a solution a few days after I made it because I ran out of time, and impurities in the beaker including water (after the beaker was washed out). wwad adw esadads ayad adba nad kcad aduk.
· · The accuracy to which I could control the surface area of potato exposed to the hydrogen peroxide.
· · Fluctuations in the precise set-up of the apparatus, including the depth of the water in the ice-cream tub (which affects the pressure which the oxygen has to push against), the relative heights of the beaker and the bottom of the burette and the air pressure on the day. I think that using two experiments set up at once (obviously can’t be identical) was a major cause of this error. This could have been the primary cause for the fluctuations at 12.5% and 15%. wwfe few esfefes ayfe feba nfe kcfe feuk!
· · The accuracy of the measurements including; the time lapse between seeing a bubble get to the surface of the water in the burette and stopping the stop clock and the size of the bubble .
· · The accuracy to which I can measure the temperature, the time lapse between finishing the reaction and taking the measurement possibly being significant because the reaction is endothermic and the hydrogen peroxide is kept in the fridge, therefore the solution will get warmer the longer one leaves it until it is at room temperature. The thermometers to which I will have access are also not very accurate.
Then the sheet on which I put the information to be transferred to graphs.
Then come the graphs in a numbered order. They need no explanation as they have complete headings.
The computer plotted the lines of best fit and some are more roughly sketched than others are.
I found that the general trend was indeed a Michaelis-Menten curve. The rate remained directly proportional to the substrate concentration at low concentrations, the straight line only curving slightly at 17.5%.
The shape of the curve followed the same pattern as shown in the prediction. I therefore have assumed that the formula that I used in the prediction is correct for this investigation. Because the highest concentration that I used was at 20%, only the first part of the graph was produced by my results.
I have found that the predicted values where fairly similar to the results that I got. For example:
Prediction Calculation
Rate 0.05ml/s 0.049ml/s
KM 5E-8 5.64E-8
Enzyme 1.2E6 1.24E6
I therefore concluded that the formula applied to this reaction.
Further proof that the graph that the results produced was not just a fluke, caused by the fluctuation in conditions throughout the investigation, is the graph that I made of the individual reaction. This shows a perfect model of a Michaelis-Menten curve. I therefore consider my hypothesis proven.
My explanation for the results is as follows: because of the increased chance of a successful collision caused by random thermal motion when there are more molecules present, there is an increase in rate with higher substrate concentration. For low concentrations the rate of the reaction is therefore directly proportional to the concentration of hydrogen peroxide in the solution. This is because if double the amounts of substrate molecules are in the solution, double the amount will find an enzyme molecule at the same time if all the substrate molecules are moving at similar speeds (the average speed being directly proportional to the temperature). Therefore if there are double the amount of substrate molecules in a solution, double the amount of reactions will take place at once and the rate will be doubled. Because of the time taken for the reaction and dissociation of the enzyme-product complex, as the concentrations of substrate increase not all the collisions of the substrate are successful because some active sites will be saturated (occupied by substrate/products). iT3VDz4 from iT3VDz4 essay iT3VDz4 bank iT3VDz4 co iT3VDz4 uk
The frequency of this occurrence increases with the substrate concentration, and eventually the terms cancel out, leading to no rate increase with substrate concentration increase at high concentrations. This is because as the rate increases this must mean that more enzyme molecules are reacting with the substrate at one time, seeing that the reaction and dislocation time is constant at constant temperature, causing more substrate-enzyme collisions to be unsuccessful due to saturation.
I also found that either the Q 10 formula itself, or the way in which I applied it, did not work in this case. This was a disappointment because I recorded a fairly large range of temperatures.
This is an evaluation of the assumptions that I have made been my conclusion and the viability of the results on which it was based.
The main weak point with my conclusion is that there is only one set of data that accurately supports it. The conclusion is based mostly on rate 1, which is derived from the oxygen produced in five minutes. I have also assumed that the result at 12.5% is an anomalous result. The grounds for the assumption are sound (I had left the solution for a few days and I was using the second set of apparatus, which will obviously not be identical to the first) but it may not be the case. The science on which the prediction is based, however, seems sound to me although I don't I doubt that there are complications which I haven't thought of yet. It is therefore feasible that the Q 10 formula worked and that the other set of results is correct. But I couldn't come up with an explanation nor find one from anywhere else. I am therefore sticking by my assumption my prediction was correct. This seems the most reasonable because it abides with the normal laws of science. wwgb gbw esgbgbs aygb gbba ngb kcgb gbuk.
The anomalies which I found where either formed when I temperature balanced the results or from the set of results that I got when I collected 20 ml at each concentration (rate 2). If I take these into account buyer have a very strange pattern which fire he cannot explain. They seem to generally show a trend of regular increase in the effect of substrate concentration on the rate of the reaction. In other words, the graph curves up before starting to plateau out. The only assumption one can make is that the quality of the results is variable and therefore only the general trend can be taken into account, which brings us back to approximate proportionality. It is therefore impossible to include the results which I have classed as anomalous in it the conclusion because I can't work out any explanation for the trend or at indeed find a scientific reason for the type of increase demonstrated.