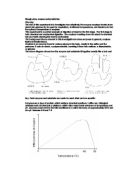
Kinetic theory is the idea that, when a substance is heated, its molecules, having been supplied with energy, move around faster. In this experiment, as the temperature increases, the enzyme and starch molecules collide more frequent and with more energy which will cause them to react more efficiently. At low temperatures, the molecules will not collide very frequently and the starch will not be broken down as quickly.
Method
To carry out this experiment I took two test tubes, and filled one with 10ml of starch solution and the other with 1ml of amylase, I did this by using a syringe. Next I placed both test tubes in the water bath at the appropriate temperature, (I used a thermometer to measure the exact temperature) they were left in the water bath for five minutes. Whilst I was waiting I took two dimple tiles and placed two drops of iodine in each dimple, I also took a beaker full of water and placed a glass rod inside it. When the five minutes finished I quickly poured the starch into the amylase, started the stop clock, put the glass rod into the mixture and stirred, took out one drop and put it on the iodine tile. Since this was the first test it was recorded at 0 minutes. The test tube was left in the water bath throughout the experiment and every thirty seconds a drop of the mixture was placed onto the iodine on the dimple tile. In between each thirty seconds the glass rod was washed in the beaker of water. I recorded the results in a table and wrote down if there was starch present in each drop, I was able to tell this if the iodine changed colour. I stopped recording results when there was no more starch present.
Variables
The independent variable was temperature, controlled during the experiment. The variable dependant on this was starch concentration. All other variables therefore had to be kept constant to ensure that the experiment was a fair test. These controlled variables were concentration of amylase and starch in the solution, time period over which the experiment was conducted and the volume of amylase solution and starch solution. The apparatus was also kept the same throughout.
Graph results
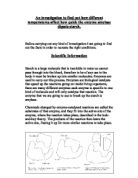
The graph shows that, between temperatures of 20oC and 40oC, the efficiency of the enzyme increases with temperature. However, the graph between these points is a curve so the efficiency of the enzyme is not proportional to the temperature. Between 40oC and 60oC, the efficiency of the enzyme decreases with temperature, mirroring the first part of the graph. The graph shows that the optimum temperature of the amylase tested was 40oC.
The graph supports my prediction that the optimum temperature of the enzyme would be around 40oC, and would have decreasing efficiency towards 0oC, at which the amylase would be unable to break down the starch at all. However, the results did not support the prediction that, at temperatures over 40oC, the enzyme would begin to denature to an extent that, at temperatures much over 50oC, it would be totally ineffective. The reason why the enzyme seems to have been able to survive without denaturing at higher temperatures is that the enzyme used was a bacterial enzyme, and bacterial enzymes do not necessarily behave in the same way as enzymes from the human body. It therefore could have had an optimum temperature of slightly above 40oC, and did not fully denature until the temperature was raised to 70oC, as shown in the results table below. The enzyme was most effective at 40oC because this is body temperature, at which is it most used to working. In order for it to function most efficiently in the body, amylase must have an optimum temperature of 40oC. The reason why the amylase was less effective at higher temperatures was that it had started to denature. All enzymes start to denature at temperatures above their optimum temperatures, which renders them unable of catalysing reactions.
Results table
Conclusion
Overall this experiment was a fair test, we discovered how well enzymes coped at different temperatures. The conclusions of my results are as follows:
- 0˚C works very slowly, the molecules move around unhurriedly, with few collusions causing little breakdown.
- 20-40˚C around these two temperatures we discovered the optimum temperature, which was mainly around 40˚C.
- 60-80˚C there was denaturation of the enzyme this caused the active site to be destroyed; the starch substrate could not be broken down.
My prediction was that the amylase would break down the starch most effectively at 40˚C. This statement proved to be mainly correct because the starch was broken down at 4.6 minutes at 40˚C. However starch was broken down the quickest at around the 50˚C mark. This was a surprise because enzymes work best at around the predicted temperature considering this is near enough our body temperature.
In my opinion I think that the reason for this result may be due to the fact that errors from different people could have been made during this experiment. For example variations of results were recorded resulting in higher temperature averages; this meant that some results were not exact. In my evaluation I have stated reasons to improve the experiment, which would help find the correct optimum temperature.
Evaluation
The experiment worked well overall, proving beyond reasonable doubt that the optimum temperature of the amylase used in the experiment was around 40oC. Despite the unpredictable nature of the experiment, the results were sufficiently accurate that they were aligned almost perfectly on a curve, and were taken at intervals far enough apart that the readings were clearly distinguishable from each other.
However, the results were not totally accurate. For example, the first time the experiment was carried out at 10oC, the starch disappeared in twelve and a half minutes, however when it was tested later it took almost nineteen and a half minutes. The graph was not a perfectly smooth curve; this might have been because the values for concentration of starch in the samples could have been obtained by first recording a reading for known concentrations, then comparing these readings with those obtained with the samples collected during the experiment.
More accurate results could have been obtained by cleaning the glass rod more thoroughly between each reading, or using a new glass rod each time, but this could not practically happen. Also when the glass rod was cleaned between each reading in the beaker this meant that solution would be left over in the beaker. Therefore when the glass rod was placed into the starch and amylase solution each time, it was being neaturalised, which weakened the solution.
The volumes of each solution could have been made more accurate by measuring the solutions using a narrower gauge measuring tube or by using a syringe. However this would only make a minor difference.
An ideal solution would have been to automate the whole system, with a sample of the mixture being automatically taken every half minute or preferably more frequently, and the concentration of starch stored on computer. This would have overcome the inaccuracies of the timing, which could not always be exact using a stop clock and someone watching it, and would have eliminated the effect of human error from the experiment. If these steps had been taken, it is likely that a graph more similar in shape to that suggested in the prediction would have resulted.
Website and books used
- http://www.worthington-biochem.com/introBiochem/introEnzymes.html