Planck’s Constant x wavespeed/wavelength= energy
Using this formula, we can find out what kinds of light give out the most energy. As all light travels at the same speed (300,000,000 m/s), we know that the wavelength of the light will determine how much energy is given out from the light. The wavelength and frequency are directly related in light, because both multiplied must give a product of 300,000,000 m/s.
We can gather by the formula that light which has a smaller wavelength will give out more energy, because when a smaller number is divided by the wavespeed and multiplied by the constant, a higher value for the energy will be given than if a large wavelength figure is divided by the wavespeed, to give a smaller figure, which when multiplied by the constant gives a smaller amount of energy.
This means that light with a small wavelength and thus high frequency will give out more energy that lights with a large wavelength and low frequency.
To investigate this variable would be very difficult, because it is very hard to know the frequency and wavelength of a certain colour of light without using extremely expensive and sensitive equipment, which I do not have available. Therefore, I will not investigate this variable, and keep it to a constant in my experiment by only using 1 colour of light.
Variable 2: Distance
Distance
Another variable that could be investigated with a solar cell is the distance between the solar cell and the light source, and the effect upon the energy transferred to the solar cell when varying distances between the solar cell and light source.
Distance directly affects the intensity of the light, and as distance increases, the light intensity decreases. We can see this in the below formula which shows us to what extent the distance between the light source and solar cell affects the energy supplied.
Light Intensity= Power/area
The value area will be replaced with the value ‘4∏r²’, because as light travels, it spreads in all directions in a spherical shape. This variable can easily be changed and controlled, therefore meaning it is easy to test. Therefore, I will test this variable in my investigation.
Variable 3:
Power
Power is the amount of energy transfer per unit of time (in seconds) so this is the amount of energy supplied to the bulb so this is the amount of energy supplied to the bulb. When increasing this, it would output more light, and when decreasing the power, less energy would be output in the light. You can vary this variable using a power pack, and it is also very easy to control with this equipment, therefore I will also measure this variable.
I have therefore decided to test out variables 2 and 3.
Hypothesis:
When investigating the two variables I stated, I think that as the distance between the bulb and solar cell increase, the light intensity will decrease because the light is occupying more space when its distance is further from the solar cell. This will mean that the energy supplied to the solar cell will be less as the distance between the solar cell and bulb increases.
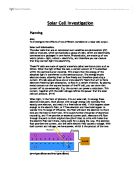
For the distance variable, using the equation stated before, Light Intensity= Power/area, we can work out the light intensity as the distance between the source of light and the solar cell varies.
Light spreads out in all directs, in the shape of a sphere, therefore it will occupy 4∏r² amount of space, where r is the distance from the light source.
Using this equation, we can make a graph of the distance against the light intensity.
This graph shows us the relationship between the distance and light intensity. The area of a sphere can be worked out by using 4∏r². As the distance of the light source increases by 1 unit, then light intensity decreases by 4 times, because it is spread out in all directions. As shown in this diagram:
With the power variable, we can again use the equation
power/area= light intensity to work out the power compared to light intensity. When considering this, we do not want to vary the area, therefore the area is constant, meaning that power is proportional to light intensity when the distance remains the same.
This diagram also shows how the light intensity decreases over distance.
Factors:
When carrying out these experiments, I will make sure the only variables that vary are the ones that I am testing, and the others are kept constant. For the first experiment when I am keeping the distance between the lamp and solar cell constant and when I am varying the voltage and current, I will make sure that I don’t accidentally move the solar cell or lamp further or nearer that the distance I started with. Also, I will make sure that the intensity of the light is always the same, and the same bulb is used with the same colour light always. I will also make sure that I turn off the bulb after taking each reading, and turning it on when taking the next reading. The reason for this because after keeping the bulb on for a long time, the wires become over heated, resulting in an increased resistance in the circuit, which will reduce the light intensity of the lamp, and thus lower the readings read by the mA.
Safety Precautions:
When conducting these experiments, there are not many safety issues, because we will not be dealing with high currents/voltages. The heat of the wires and the lamp may be hazardous to touch; therefore we will not touch these when they are on.
Apparatus:
-Solar Cell
-Ammeter
-Milliammeter
-Voltmeter
-25 watt bulb
-Variable Resistor
-12V power supply
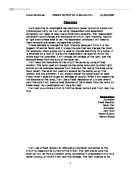
The apparatus will be set up, as shown in the circuit below.
The first experiment that will be done is to keep the distance between the lamp and the solar cell constant, and then vary the voltage/current by varying the strength of the variable resistor. Ten results will be taken, which won’t have very high currents, because the mA is very sensitive, and will not be able to record electrical currents, which exceed its meter’s limit. I will then repeat the experiment in order to get more accurate results by making sure the results are correct and I can also obtain an average by adding the sets of results and dividing them by the number of different results taken.
The second experiment I will do is to keep the voltage/current constant, and vary the distance between the lamp and solar cell. As said in my hypothesis, I suspect that the light intensity will greatly decrease as the distance between the lamp and solar circuit increases, therefore I will make the distance changes fairly small, so that the reading that I am given isn’t so small that it is not possible to differentiate from other results. I will vary the distance by 1cm each time, and take 15 results, so that my readings will be easy to differentiate and also I will have enough results to establish a decent pattern between results. I will also then repeat the experiment in order to get more accurate results by making sure the results are correct and I can also obtain an average by adding the sets of results and dividing them by the number of different results taken.
Obtaining Evidence
Experiment 1 results:
In this experiment, I varied the power supplied to the lamp to see the output to the solar cell.
I then repeated the experiment to make sure the results were accurate. I could therefore then take an average:
Experiment 1 results:
Here are the results for the second experiment, where the distance between the solar cell and light source was varied to see the power output on the solar cell.
I then repeated the experiment to make sure the results were accurate. I could therefore then take an average:
I also did the same experiment with 5cm gaps each time: (table below)
I then repeated the experiment to make sure the results were accurate. I could therefore then take an average: (table below)
Averages of previous 2 tables.
Factors:
When carrying out these experiments, I made sure the only variables that vary are the ones that I am testing, and the others are kept constant. For the first experiment I kept the distance between the lamp and solar cell constant and when I was varying the voltage and current, I made sure that I didn’t accidentally move the solar cell or lamp further or nearer that the distance I started with. Also, I made sure that the intensity of the light is always the same, and the same bulb is used with the same colour light always. I also made sure that I switched the bulb off after taking each reading, and turning it on when taking the next reading. The reason for this was because after keeping the bulb on for a long time, the wires become over heated, resulting in an increased resistance in the circuit, which will reduce the light intensity of the lamp, and thus lower the readings read by the mA and would have made the results inaccurate.
Safety Precautions:
When conducting these experiments, there are not many safety issues, because we will not be dealing with high currents/voltages. The heat of the wires and the lamp may be hazardous to touch; therefore we will not touch these when they are on.
Analysing evidence and drawing conclusions
From the data recorded and calculated from the above tables I can represent it visually by plotting graphs
I will first make a graph of the results of the second experiment, to see whether or not I get the correlation expected.
The first graph shows Output current against distance
Looking at this graph I can see that there is a y=1/x or y=1/x² correlation. I can tell this because the graph falls at a steep gradient and then at around 3 or 4 cm mark the graph shallows as it curves off.
This does not show a straight line and so does not show a direct relationship between the distance and solar cell output.
Though it is possible to try Output current against 1/distance or output current against 1/distance² as this may produce a direct straight-line correlation.
This graph below shows the output current against 1/Distance. It shows a small curve where there is a small gradient at the beginning, which gradually gets steeper. Which resembles a y=x² curve.
The next graph shows the results of current versus 1/distance². This graph shows a fairly good correlation between the two different data. The line of best fit is a straight line; therefore, I can say that the inverse square of the distance is proportional to the output current. This is therefore an example of the inverse square law.
This graph shows a fairly good correlation between the two different data. Therefore, I can say that distance is proportional to the inverse square of the energy output in this, thus meaning that the inverse distance squared is proportional to the current output.
The graph shows an almost straight correlation between the solar cell output and the power from the bulb. The graph shows a very slight curve like a y=x² curve or more like a y=x^1.5 curve.
Conclusion
After plotting the graphs we can conclude various points.
After analysing the graphs of solar cell output and √1/cell-output against distance we can see that there is evidence of an inverse square law.
ie. The √1/cell-output gives a straight line when plotted against distance, which is the same as plotting solar cell output against 1/distance². This means there is evidence to suggest that solar cell output is proportional to the inverse square distance between the cell and the bulb.
In my hypothesis I predicted that the solar cell output would have a 1/x² relationship with the distance. Looking at the graph that shows the relationship between the solar cell output and distance the hypothesis has been supported and shown to be correct.
The reason for this relationship is because of the fact that light spreads out in an expanding spherical shape.
The surfaces area of the sphere increases in proportion to the square of the increase of the distance between the cell and the bulb. As area is the variable denominator in the intensity formula, it means that if area doubles intensity would halve.
e.g.
Power/area= light intensity
=6/1
=6
Power/area= light intensity
6/(1*2)=6/2
=3
However according to the first point there is a square relationship between area and the distance. This means that as the distance is doubled the area will be quadrupled and the intensity would be quartered.
This is because of the fact the solar cells work on the principle of ionisation. They are semiconductors and require photons of light to hit the solar cell to give an electron, within an atom, enough energy to break away and move freely, allowing it to conduct electricity.
As the light gets further away the area is spreading out from a central point by the square of the distance, so less photons are hitting the solar cell, even thought the light emits them at a constant rate, as power is constant. It is only the inverse square law photons that hit the solar cell.
The same number of photons of light is being emitted per second (as power is constant) by the bulb. As the distance between the cell and the bulb is increased, the area where the photons are hitting the cell every second as the distance increases.
Evaluation
When looking at the graphs I made with my results that I took, I can see that generally there are very strong trends, but there are some anomalies in my data. Looking at the graph for my second experiment, the one where 1/distance is plotted against output of current, we can see a few small anomalous points. (Which are circled)