Plan
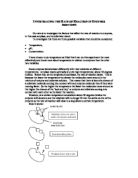
- Set up the equipment as shown in the diagram above.
- Put 10ml of catalase and an amount of buffer in the conical flask. The catalase should be put in a water bath at 30ºc prior to this. This means that the temperature is maintained at 30ºc, meaning that it is a fair test. Prepare three lots of each pH level in conical flasks.
- Put 25ml of hydrogen peroxide in the conical flask with the catalase and the buffer. Put the bung quickly in the conical flask.
- Time the reaction for 2 minutes then measure the volume of gas produced in ml. Repeat this three times for every buffer for reliability. Use a range of buffers from pH1 – pH9.
Preliminary Results
I did a preliminary test to see what amount of buffer I needed to use to keep the solution at a certain pH. For my preliminary results I used a pH1 buffer.
My preliminary results show that 50ml of buffer keeps the solution at pH1. The minimum amount of buffer I could use however is 45ml. I will use this amount for my experiment so I don’t waste buffer, but the amount is also easy to measure.
Results Table
Conclusion
My graph shows a curve that peaks towards the end. The activity of the enzymes increased to a maximum of pH9. This shows that the catalase seems to work best at pH9. I cannot say that this definitely was the optimum pH, as I didn’t measure any further in this investigation, but the pattern on the graph was how I had predicted for an optimum pH. This suggests that my prediction was right because there does seem to be an optimum pH level for this enzyme. This is because a change in pH can break ionic bonds keeping the enzyme together, and it also affect the charges on the amino acids in the active site, so the enzyme cannot create an enzyme-substrate complex. This means that the enzyme doesn’t work as fast, so the rate of reaction decreases unless the optimum pH is used.
Evaluation
In this investigation my plan was very suitable for the investigation. From my preliminary results I chose the amount of buffer to use, according to how much was needed to maintain the pH of the solution. My measurements were accurate; I measured each one in a measuring cylinder at eye level. In my results I did get one anomalous result for pH3. This could have been because of the oxygen lost before I put the bung on the conical flask, or because the concentration of catalase varied for each test, as we could not measure the concentration. This could have caused my anomalous result, and made each test a bit less reliable. I think my experiment was fairly reliable, but the sets of results we got weren’t always that close together. This could have been because of the concentration of catalase; we had no way of measuring it so that could have affected the tests. My results weren’t enough to show that my prediction was right because I didn’t repeat the experiment enough times to say that my prediction is right as an absolute rule. I only repeated it three times, to get a complete idea of the relationship between enzyme activity and pH level I would have to have repeated it a lot more times. Also I could have used a full range of pH levels to get a better idea of the pattern on the graph, and the activity of enzymes in certain pH conditions. I could have improved my experiment by using a constant concentration of catalase. This would have improved my results to make them more reliable as the only factor that would have been changed would have been the pH level.
To further this investigation I would have liked to test the effect temperature has on enzyme activity. I would do this by using the same pH buffer to maintain the same pH of the solution, and by changing the temperature of the catalase before I put it into the solution. I would use different temperatures such as 5ºc, 20ºc, 37ºc and 50ºc. This way I would have fridge, room, body and a high temperature. This would tell me around which temperature the enzymes work at best. I would predict this would be at around 37ºc because it is the same temperature as our bodies maintain, so it would have to work best in our bodies.